- Gold price forecast remains bearish below an intraday pivot point level of 1806.97 today.
- The trader’s attention has now shifted to the European Central Bank’s meeting on Thursday.
- Forex trading market participants may sell below the $1,793 level to target $1,780.
The precious metal gold prices closed at $1797.55 after reaching a high of $1829.40 and a low of $1793.95. The XAU/USD extended its loss and dropped for the 3rd consecutive session to reach below the $1800 level. Gold fell more than 1.5% in a single day and posted its biggest intraday drop in a month amid the rising demand for the US dollar and higher US Treasury Yields. Gold price forecast remains bearish below an intraday pivot point level of 1806.97 today.
If you are interested in trading XAU/USD with forex robots, check out our guide.
A stronger US dollar drags gold prices below 1,800.
The US Dollar Index (DEX), which measures the greenback’s value against the basket of six major currencies, broke its 7-day bearish streak. It jumped 0.5% towards the 92.5 level, recovering some of its previous losses. Furthermore, the US Treasury yield on the benchmark 10-year note also surged and reached 1.38%, its highest since mid-July.
A firmer dollar and higher US yields dented the demand for safe-haven bullion and dragged gold prices below the $1800 level. Gold fell further from its 2-and-a-half-month highest level that it reached on Friday after a surprisingly soft US payroll report from August. It boosted speculation that the Fed might push back the tapering of its bond purchases.
The European Central Bank’s Meeting in Highlights
The traders’ attention has now shifted to the European Central Bank’s meeting on Thursday, where the officials are highly anticipated to start debating about rewinding stimulus measures as the eurozone economy is returning to normal from the pandemic.
Gold is known as a hedge for currency debasement and inflation caused by massive stimulus measures. Now the world’s central banks are discussing reducing their stimulus measures, which negatively impacts bullion’s appeal and, hence, gold declined.
Another reason behind the declining prices of precious metals could be nervous sentiment in the market. It’s been driven by the failed attempt by gold to break above its key area of resistance around the $1835 level.
Johns Hopkins University Releases an Update on COVID-19
According to Johns Hopkins University, the global tally for the coronavirus infection climbed over 221 million, with the death toll rising above 4.57 million. The United States is leading the world with 40 million cases of infection and nearly 650,000 deaths. The country has only 53% of its population fully vaccinated against COVID-19, which has left 47% at risk of severe illness and death.
According to a New York Times tracker, the country was averaging more than 1500 deaths per day for the first time since March, and the daily case count has increased by five times since the beginning of August. These adverse developments from the coronavirus front in the US kept the Fed from giving any specific timeline for tapering stimulus measures.
The spread of the Delta variant of coronavirus has caused the third wave in the country, which hit the job sector of the nation and weighed on the US dollar. Despite such adverse developments, the greenback remained green without any macroeconomic data releases for the day. Thus, it continued weighing on the precious metal.
Gold Price Forecast – Technical Levels
Support Resistance
1784.54 1819.99
1771.52 1842.42
1749.09 1855.44
Pivot Point 1806.97.
Gold Price Forecast – Trendline Breakout to Drive Selling Below $1,816
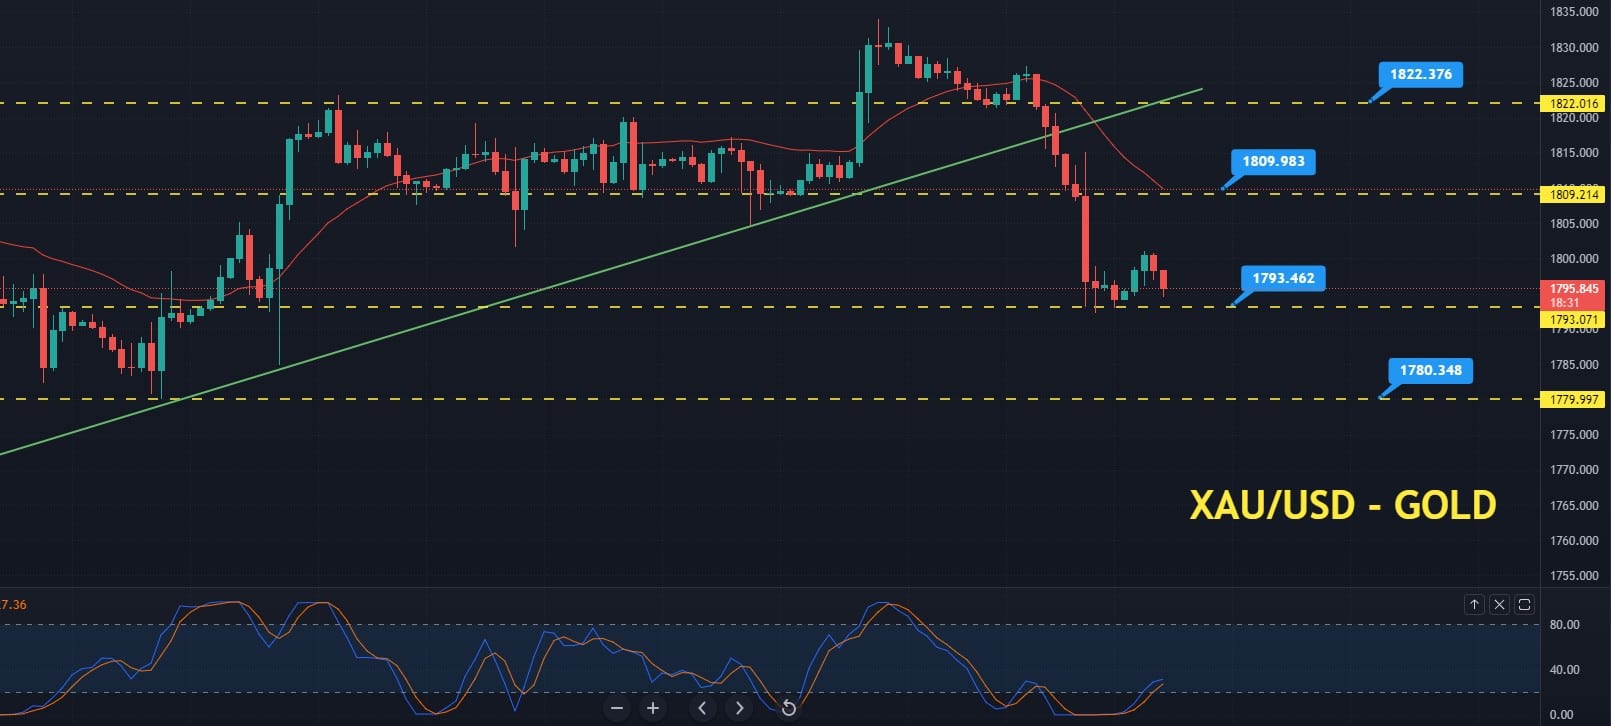
On Wednesday, the gold price forecast remains bearish below an intraday pivot point level of 1806.97 today. On the 4 hour timeframe, it’s heading lower towards the next support area of 1,793; a double bottom pattern is prolonging that. Lately, the stronger dollar has triggered the bearish breakout on an upward trendline.
Currently, the same support level of 1,816 is likely to work as resistance for gold. On the bearish side, the bearish breakout of the 1,793 level is likely to open further room for selling until the next support levels of 1,785 and 1,779.
Taking a look at the 50 period EMA (exponential moving average – red line), it is holding around the 1,809 level. The closing of candles below this level supports a strong selling bias in the precious metal, gold. Moreover, the leading indicator, Stochastic RSI, stays below 50, keeping the bearish trend in gold.
With that being said, investors are likely to keep an eye on the 1,793 level. Thus, they may look to place a sell-stop below the 1,793 level to capture a strong selling position until the 1,780 level.
Therefore, Forex trading market participants may sell below the $1,793 level to target the $1,780. Alternatively, traders can take a buying position above the $1,806 level today. All the best!
Looking to trade forex now? Invest at eToro!
67% of retail investor accounts lose money when trading CFDs with this provider. You should consider whether you can afford to take the high risk of losing your money.