- NFP data from the Bureau of Labor Statistics could be a key to the decision about the tapering of stimulus measures by the Federal Reserve.
- Chicago PMI from August declined to 66.8 against the predicted 68.0 and pushed yellow metal even higher.
- Forex trading market participants may buy above the $1,807 level to target the $1,815 and 1,821 levels.
Gold closed at $1817.15 after placing a high of $1821.85 and a low of $1803.75. Gold turned green on Tuesday and recovered some of its previous daily losses on the back of the weak US dollar for the day. The gold price forecast remains bullish above the 50 EMA support level of 1,813 today. The gold price forecast remains bullish above the 50 EMA support level of 1,810 today.
If you are interested in trading XAU/USD with forex robots, check out our guide.
Weakness in the US Dollar Underpins Gold
The US Dollar Index, which measures the greenback’s value against a basket of six major currencies, continued its fall for the third consecutive session. It dropped on Tuesday to its lowest level in 18 days, at 92.40. On the other hand, the US Treasury Yield rose on the benchmark 10-year note on Tuesday and reached 1.316%.
The US dollar was under pressure from the dovish remarks of Fed Chairman Jerome Powell during the meeting at the Jackson Hole Symposium last week. Powell did not provide any clear signal on the timeline for tapering by the central bank. Furthermore, the pressure from these comments from Powell was not lifted. While the dollar faced yet another round of pressure with investors now looking forward to the US NFP data release, which is scheduled for Friday.
US NFP Figures in Focus This Week
Investors believe that the NFP data from the Bureau of Labor Statistics could be a key to the decision about the tapering of stimulus measures by the Federal Reserve. The market is expecting an increase of 728,000 jobs, with the unemployment rate falling to 5.2%. Moreover, the average hourly earnings rising 0.4% monthly.
If job creation meets market expectations or comes in greater than expected, then it could be a game-changer. Thus, it may prompt the central bank to start tapering sooner than expected. However, if the figures fall short of expectations, then the dollar might see another round of weakness and push the price of yellow metal even higher towards the $1900 mark.
Gold closed its last trading day of August with a 0.3% gain. However, the exciting thing was that the precious metal also ended its month with the same number of gains in hand.
Furthermore, gold managed to end its monthly trading session above the $1800 mark and has shown the potential to cross the $1900 mark if the weakness of the US dollar continues. However, there were not many pieces of evidence that these positive stances were celebrated in the market. Everyone was more focused on the tapering monetary stimulus from the Fed. In addition to this, the market focus has now been shifted for this week towards the non-farm payroll data.
Quick Economic Events Review
On the data front, at 18:00 GMT, the Housing Price Index from June dropped to 1.6% against the projected 1.9%. The S&P/CS Composite-20 HPI for the year surged to 19.1% against the forecasted 18.7% and supported the US dollar.
At 18:45 GMT, the Chicago PMI from August declined to 66.8 against the predicted 68.0 and pushed yellow metal even higher. At 19:00 GMT, the CB Consumer Confidence also dropped to 113.8 against the projected 122.9 and added further gains in yellow metal on Tuesday’s trading session.
Gold Price Forecast – Technical Levels
Support Resistance
1806.65 1824.75
1796.15 1832.35
1788.55 1842.85
Pivot Point: 1814.25
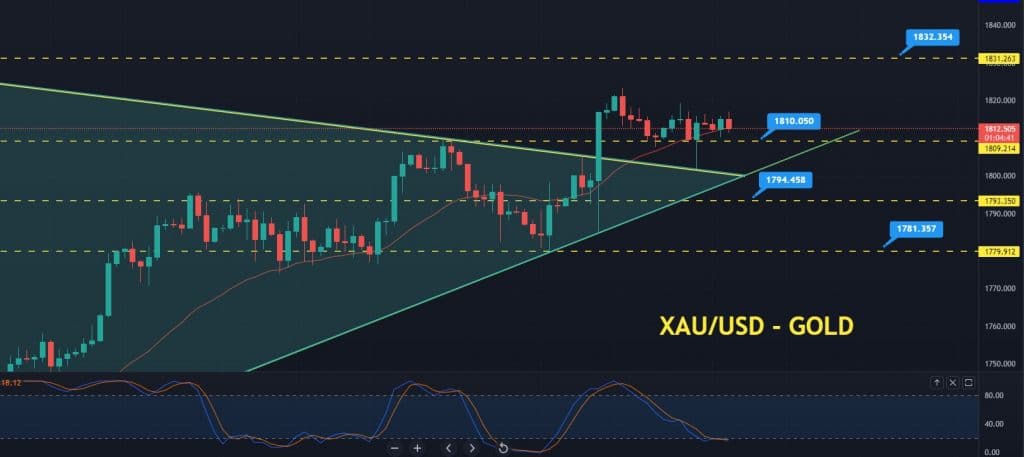
Gold Price Forecast – 50 EMA Underpins XAU/USD at 1,813
The gold price forecast remains bullish above the 50 EMA support level of 1,810 today. In the 4-hourly timeframe, gold violated the symmetrical triangle pattern at the 1,809 level, and ever since, the precious metal has been on a bullish run.
Currently, gold is gaining support at a 1,813 level extended by a 50 day EMA (exponential moving average-red line). Above this, the precious metal may find next resistance at 1,821 and 1,832 levels.
On the bearish side, a bearish crossover below the 50 EMA line could lead the gold price towards 1,810 and 1,794 support levels. The leading indicator, Stochastic RSI, stays above 50, demonstrating a bullish trend in gold.
As we can see on the 2-hour chart, gold prices fell to test the support level of 1,810 level. But it ended up closing with a Doji and spinning top cables, followed by bullish engulfing candles on the 2-hour chart. This demonstrates a bullish bias among investors. Thus, the Forex trading market participants may buy above the $1,807 level to target the $1,815 and 1,821 levels. Alternatively, selling trades can be seen below the $1,807 level today. All the best!
Looking to trade forex now? Invest at eToro!
67% of retail investor accounts lose money when trading CFDs with this provider. You should consider whether you can afford to take the high risk of losing your money.