- Bureau of Labor Statistics is due to release CPI and Core CPI data from the US.
- Coronavirus cases have surged by about 35% in the US, keeping gold supported.
- Forex trading market participants may sell below $1,736 to target the $1,711 and $1,704 levels.
The XAU/USD prices closed at $1727.80 after placing a high of $1739.35 and a low of $1718.60. Whereas, the Gold price forecast remains bearish for the 6th consecutive session as the US dollar and the US Treasury Yields rose. However, the steep sell-off in the gold price eased a little amid lingering doubts over the economic recovery. While, the growing spread of the Delta variant of the coronavirus throughout the world is causing a risk-off sentiment in the market.
If you are interested in trading XAU/USD with forex robots, check out our guide.
Stronger US dollar Continues to Weigh on Gold at 1,736
The US Dollar Index that measures the greenback’s value against the basket of six major currencies surged for the third consecutive session on Tuesday to 93.14, its highest level since 21st July. Treasury Yields on benchmark 10-year note also surged and reached 1.357%, the highest since 14th July.
The greenback was high onboard amid the persistent optimism about the interest rate hike. Moreover, tapering of asset purchases also remains in highlight amid improved employment figures. The US job data is improving every week along with the inflation above the target of 2%.
Investors believe that employment will achieve its set target eventually, and the central bank will have to reduce the economic support. For newbies, the Fed has been providing financial support to people to curb the effects of coronavirus on the economy.
Covid Fear Underpinds Safe-haven Gold Prices
On the other hand, the precious metal also found some support on Wednesday amid the Delta variant. The Delta variant of coronavirus is increasing in cases in several Asian countries and the United States, threatening the global economic outlook.
Coronavirus cases and hospitalizations in the United States were at a 6-month high level. That’s accelerated by the rapid spread of the Delta variant across the country, tackling with low vaccination rates. Over the past week, coronavirus cases have surged by about 35% in the US. Well, that averaged about 100,000 for three days in a row. The hospitalization rate also rose by about 40%, and the death rate increased by 18% nationwide in the past week.
Most alarming thing…
The most alarming thing that has raised the concerns is the number of children hospitalized with coronavirus. That ratio is rising across the US, and health experts have said that the Delta variant is more likely to infect children. In contrast, the original Alpha strain was less likely to infect children.
Prelim Nonfarm Productivity Extend Support to Precious Metal
The rising concerns over the economic recovery caped some of the losses in gold prices due to safe-haven appeal. At 15:00 GMT, the NFIB Small Business Index for July dropped to 99.7 against the forecasted 101.9. The Prelim Nonfarm Productivity (at 17:30 GMT) for the quarter rose to 2.3% against the anticipated 3.3%. Whereas, the positive figure supported the US dollar and dragged gold prices lower. Lastly, the Prelim Unit Labor Costs remained flat with the expectations of 1.0%.
On Wednesday, the Bureau of Labor Statistics will be releasing US CPI and Core CPI figures that will determine further price action in the precious metal gold.
Gold Price Forecast – Technical Levels
Support Resistance
1717.81 1738.56
1707.83 1749.33
1697.06 1759.31
Pivot Point: 1728.58
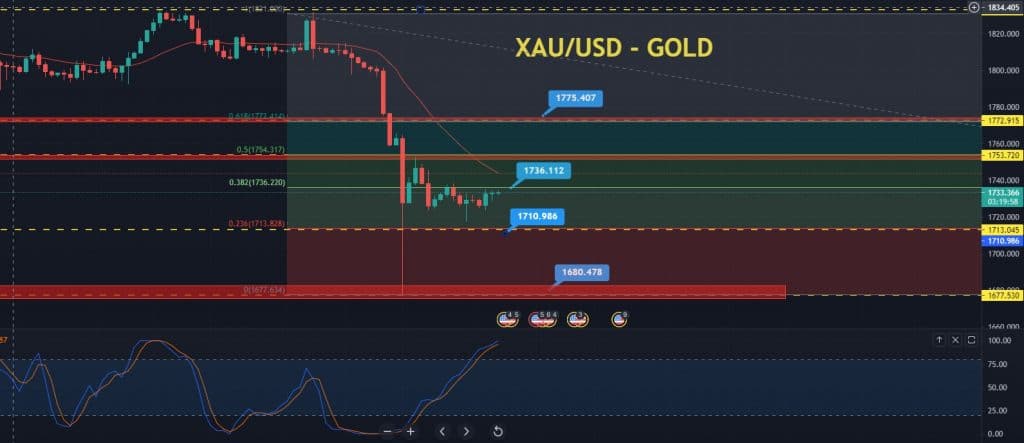
Gold Price Forecast – Daily Technical Analysis: 38.2% Fibonacci Extending Resistance
The XAU/USD price forecast remains bearish below the $1,736 resistance level. Gold has completed 38.2% and 50% Fibonacci retracement levels on the daily chart at $1,736 and $1,754. The XAU/USD fell sharply after testing the resistance level of $1,754, and now it’s heading towards a 23.6% Fibonacci retracement level of $1,711.
The bearish breakout of the support level of $1,711 can extend the selling trend until the next support level of $1,689 and $1,668. Currently, gold’s immediate resistance holds around 1,736 level that’s extended by a 38.2% Fibonacci level.
On the daily chart, the 50 days EMA (exponential moving average – red line) is holding at a $1,753 level, demonstrating a strong selling trend in gold. Lastly, the leading indicator Stoahstic RSI has come out of the oversold zone, and it’s holding at 64, above the crossover level of 50. It’s suggesting a bullish trend in gold.
Since EMA and RSI indicators are confusing, it’s best to wait for the RSI indicator to cross below 50 before placing a sell trade. The Forex trading market participants may sell below $1,736 to target the $1,711 and $1,704 levels. All the best!
Looking to trade forex now? Invest at eToro!
67% of retail investor accounts lose money when trading CFDs with this provider. You should consider whether you can afford to take the high risk of losing your money.