Gold clings to 100-day EMA amid a lack of fresh catalysts, US-China tussle in focus
Following its first negative daily closing in the week, Gold prices cling to 100-day EMA while flashing $1,465 as a quote during Friday’s Asian session.
Despite challenges to the US-China trade deal and doubts over the global economy, the yellow metal recently dropped as the US dollar (USD) managed to lure risk-averse traders. Read more”¦
Gold technical analysis: Eyes support at $1,456
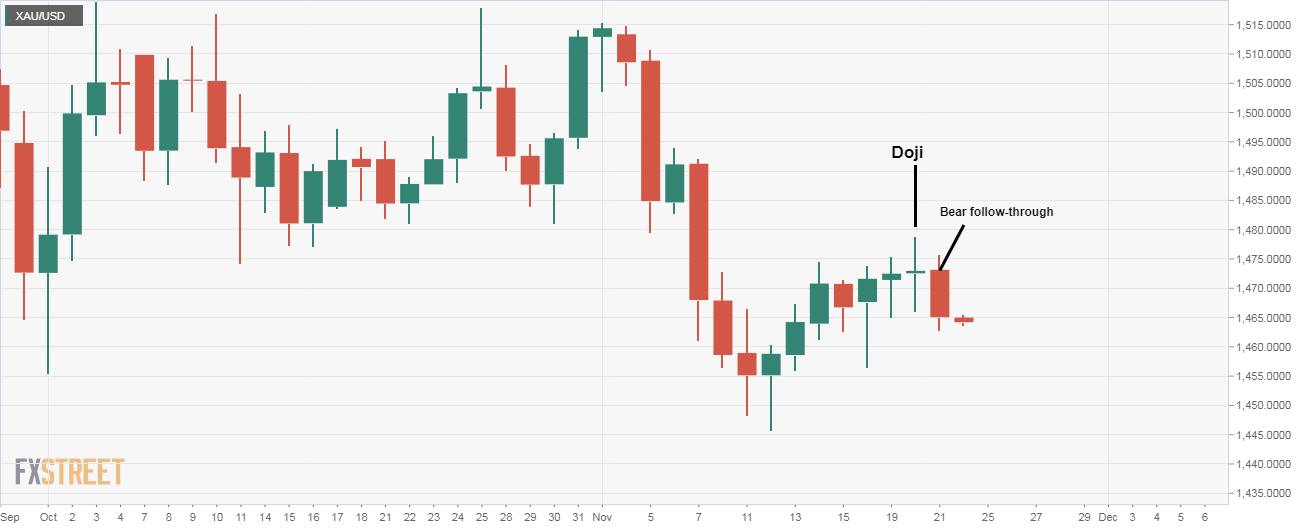
Gold prices could drop to support at $1,456, the candlestick pattern on the daily chart indicates.
On Thursday, the yellow metal closed below $1,466 – the low of the Wednesday’s Doji candle – confirming a bearish reversal. Put simply, the corrective bounce from the Nov. 12 low of $1,445 has ended and the bears have regained control. Read more…
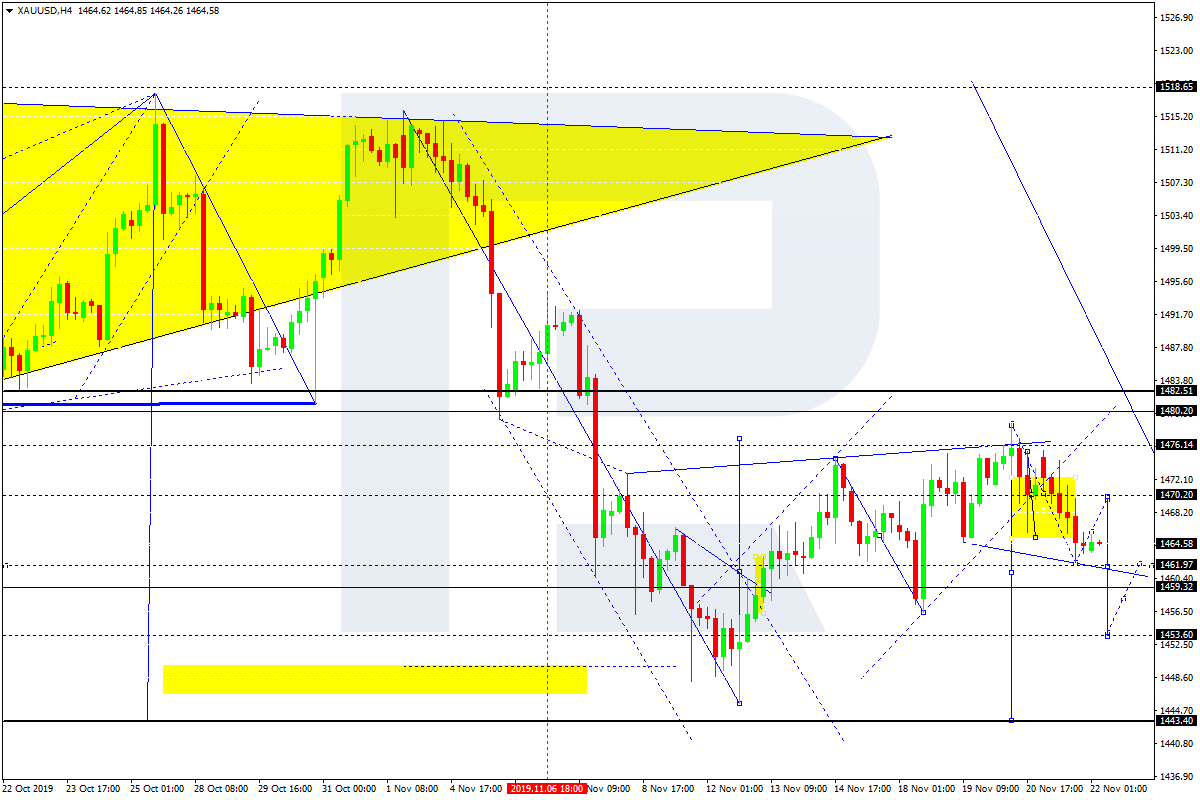
XAU/USD, “Gold vs US Dollar”
Gold has completed the descending impulse at 1461.91. Possibly, the pair may start a new correction towards 1470.20 and then continue trading inside the downtrend with the short-term target at 1463.60. Read more…