- The XAU/USD could drop again after reaching the 150% Fibonacci line.
- The up channel is seen as a bearish pattern.
- Taking out the dynamic resistance signals further growth.
The gold price turned bullish on the day, breaking above the $1,800 mark. USD’s weakness helped the yellow metal to come back higher.
Fundamentally, Gold crashed last Thursday after the US Final GDP rose by 3.2%, beating the 2.9% growth expected. Meanwhile, the Unemployment Claims came in at 216K versus the 221K expected.
–Are you interested to learn more about forex signals? Check our detailed guide-
Also, the XAU/USD signaled exhausted buyers as the Canadian CPI reported a 0.1% growth versus the 0.0% growth expected, while the US CB Consumer Confidence came in at 108.3 versus 101.0 estimates.
On Friday, the US reported mixed data. The Revised UoM Consumer Sentiment, New Home Sales, Personal Income, and Core Durable Goods Orders came in better than expected. In addition, the Core PCE Price Index came in line with expectations, while Personal Spending Reported worse than expected data.
Today, the US data could have an impact on Gold. The Goods Trade Balance is expected at -96.2B versus -99.0B in the previous reporting period. Prelim Wholesale Inventories could report a 0.4% growth, while HPI may register a 0.9% drop. Furthermore, the S&P/CS Composite-20 HPI will be released as well.
Gold price technical analysis: Bullish rebound
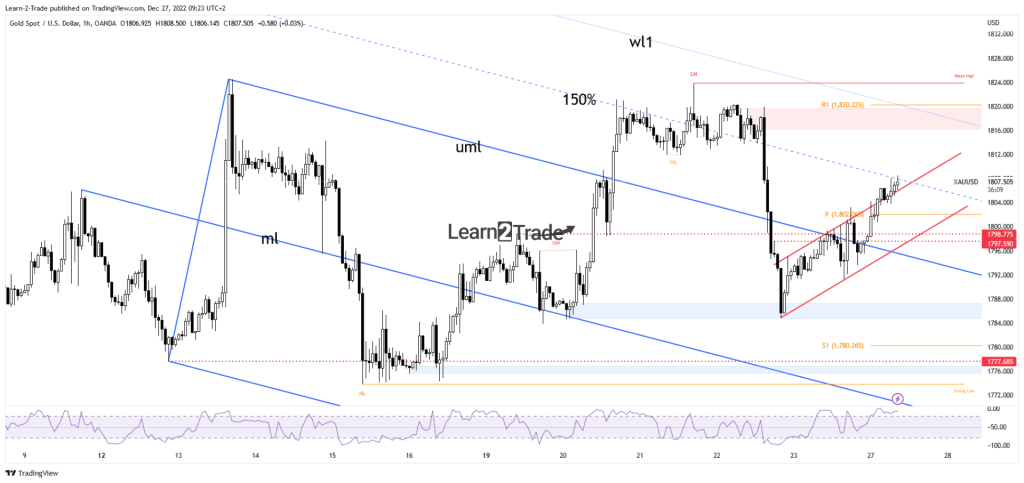
Technically, the XAU/USD reached the 150% Fibonacci line, representing a dynamic resistance. Now, it challenges the uptrend channel’s broken resistance. As long as the price stays above the channel, it could resume its growth. Taking out the upside obstacle represented by the 150% Fibonacci line may announce further growth in the short term. The weekly R1 (1,820) and the descending pitchfork’s warning line (wl1) represent major resistance levels.
–Are you interested to learn more about low spread forex brokers? Check our detailed guide-
Still, false breakouts above the 150% Fibonacci line and failing to stay above the channel’s upside line may trigger a new sell-off. The weekly pivot point of 1,802 represents the first downside target and obstacle. The channel’s descending line represents dynamic support. Failing to stay above the upside may indicate that the channel could represent a bearish formation. Still, only a valid breakdown below the up trendline could announce a new downside continuation.
Looking to trade forex now? Invest at eToro!
67% of retail investor accounts lose money when trading CFDs with this provider. You should consider whether you can afford to take the high risk of losing your money.
