As discussed in our last analysis on gold from January 5, a bearish AB=CD pattern was forming with a 100% D leg completion at 1,273.9. That price target was reached last Friday as gold hit a high of 1,282.11 for the week. Although not assured, a pullback is now possible. In addition to the ABCD completion, potential resistance can also be seen in this general price area from previous price structure (support and resistance).
Alternatively, a decisive rally above last week’s high could see gold hit its next target of approximately 1,302.8, the 127% Fibonacci projection of the CD leg.
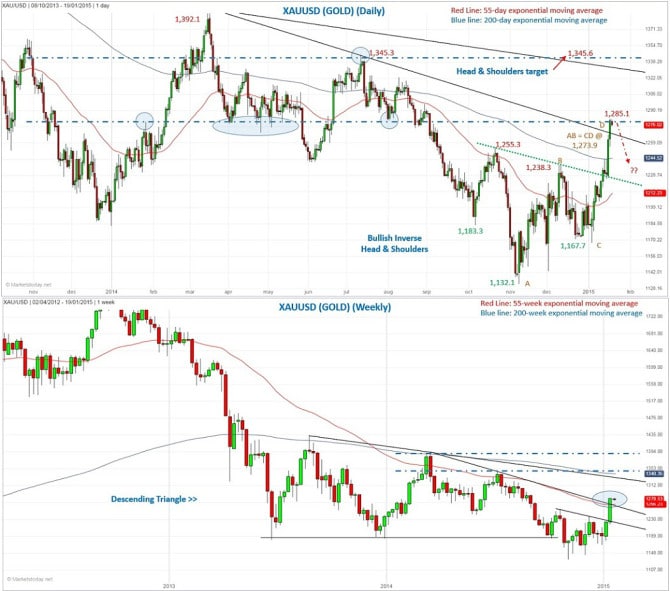
The odds of a higher rally following a pullback are good. A couple of the supporting factors are as follows:
“¢Inverse Head & Shoulders minimum target not yet reached
“¢Weekly close occurred above the internal downtrend line. The next and longer downtrend line, across the top of a large descending triangle, is higher.
“¢Weekly close above the 55-week exponential moving average (ema). Last week was the first time there’s been a weekly close above the 55-week ema since early-July 2014, and only the third time since gold’s decline accelerated in April 2013. However, note that each of the two prior moves above the 55-week lasted no more than two weeks (not bullish).
“¢Back above the 200-day ema for first time since August 2014
