- Gold trades near the eight-day high.
- 38.2% Fibonacci retracement, a falling support line since mid-August gain sellers’ attention during the pullback.
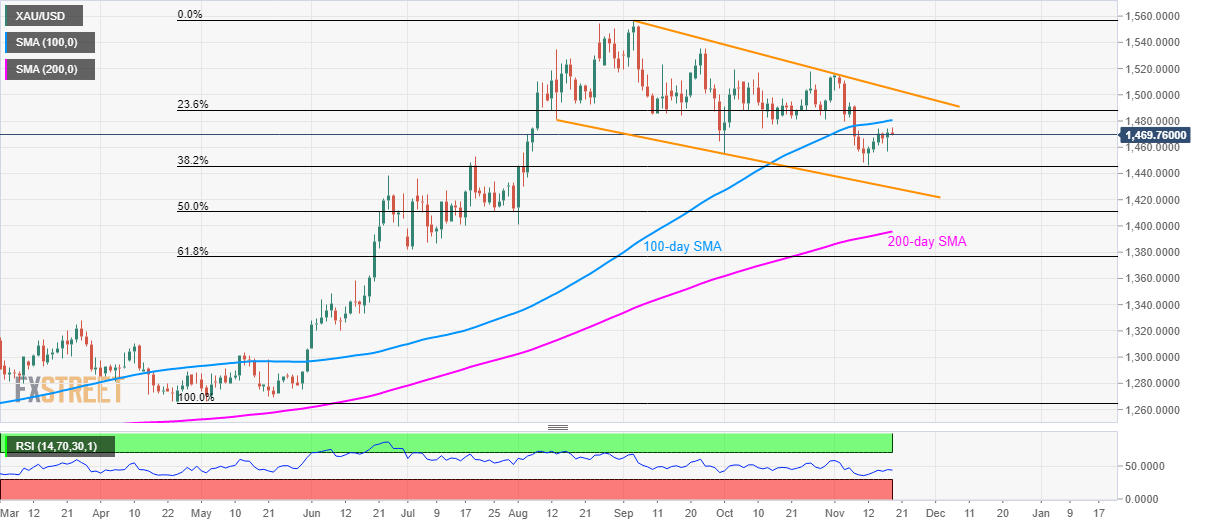
Gold’s recovery from 38.2% Fibonacci retracement fails to sustained beyond an eight-day high as it slips to $1,470 ahead of Tuesday’s European open.
Prices are likely to revisit the 38.2% Fibonacci retracement of April-September upside, at $1,445. However, a downward sloping trend-line since August 13, at $1,429, followed by a 50% Fibonacci retracement level of $1,410 limits the bullion’s further declines.
Should there be bears’ dominance below $1,410, 200-day Simple Moving Average (SMA) level of $1,395 will be the key to watch.
Meanwhile, buyers are looking for entry beyond a 100-day SMA level of $1,480 to aim for 23.6% Fibonacci retracement level of $1,489 and an eleven-week-old descending trend line, at $1,504.
If at all bulls keep the head high beyond $1,504, monthly top near $1,515 and September 25 high around $1,535 will become buyers’ favorites.
Gold daily chart
Trend: Sideways
