- Gold maintains the range above 23.6% Fibonacci retracement since the week’s start.
- The yellow metal lacks the strength to cross key upside barriers holding the keys to monthly top.
Despite trading in a small range, Gold’s upside has fewer odds due to the key resistances standing untouched while the quote seesaws near $1,492 during early Friday.
Among the upside barriers, 200-bar Simple Moving Average (SMA) level of 1,503 and a falling trend line since September 04, at $1,510 now, comes nearby.
Should prices rally beyond $1,510, monthly top and 61.8% Fibonacci retracement of September-October declines, around $1,518/19, could question buyers targeting $1,535 and $1,557 numbers to the north.
Meanwhile, a downside break below 23.6% Fibonacci retracement level of $1,479.50 can take aim at $1,465 and month’s low of $1,459.
Gold 4-hour chart
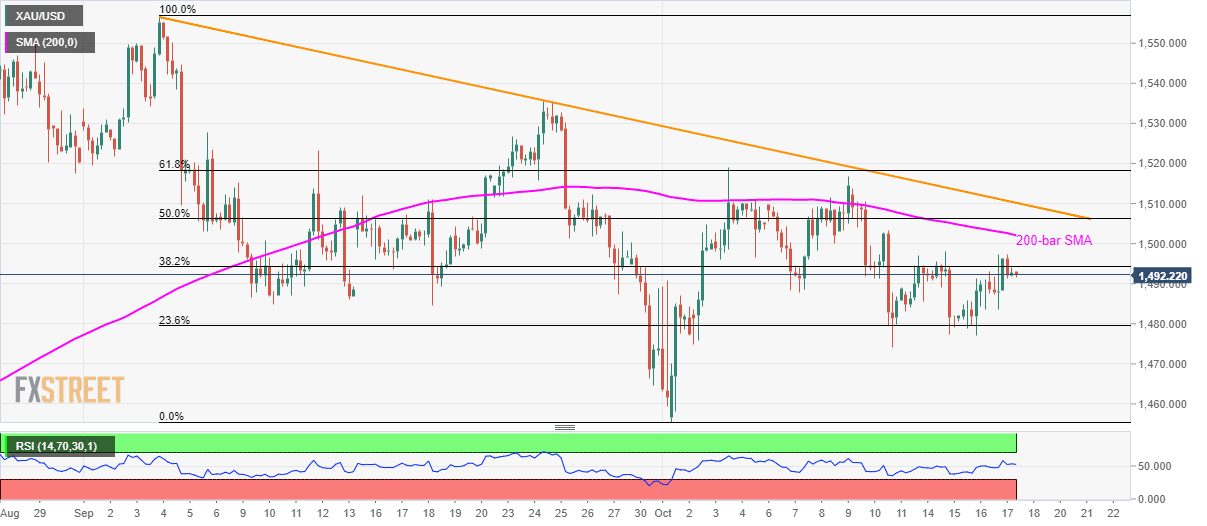
Trend: bearish
