- Gold prices struggle between key technical indicators amid stable RSI.
- The latest recovery has multiple resistances on the upside before restoring investor confidence.
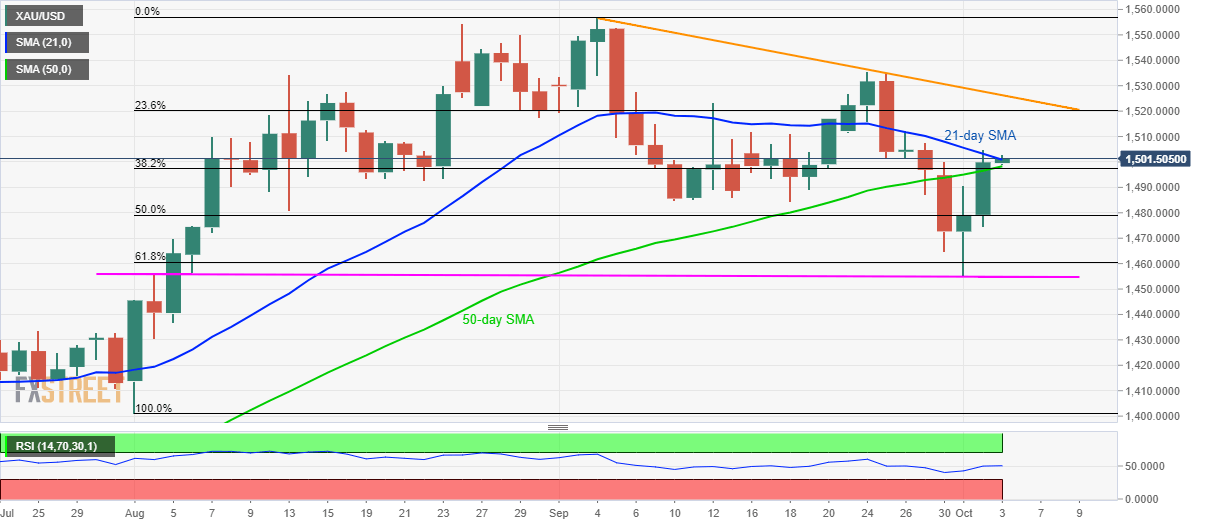
Gold prices turn choppy inside the $5 range while taking rounds to $1,501.50 during the Asian session on Thursday.
While a 21-day simple moving average (SMA) limits the Bullion’s upside, a confluence of 50-day SMA and 38.2% Fibonacci retracement level of August-September advances restricts immediate declines.
It should also be noted that 14-day relative strength index (RSI) seesaws in the normal territory between 70 and 30 level, which in turn cuts the odds of any price swing.
As a result, the quote’s run-up beyond 21-day SMA level of $1,502 can target 23.6% Fibonacci retracement level close to $1,520. However, a downward sloping trend-line since early-September, at $1,526, could challenge buyers then after.
On the contrary, a downside break of $1,498/97 support confluence could trigger fresh pullback to September 10 low nearing $1,485 while 50% and 61.8% Fibonacci retracement levels near $1,479 and $1,460 might entertain bears ahead of questioning the downside with $1,456/55 horizontal area including monthly low and early-August extremes.
Gold daily chart
Trend: sideways
