- Gold pulls back to short-term support-line.
- Sellers aim for 100-HMA if confirming rising wedge breakdown.
- Bearish MACD favors the downside.
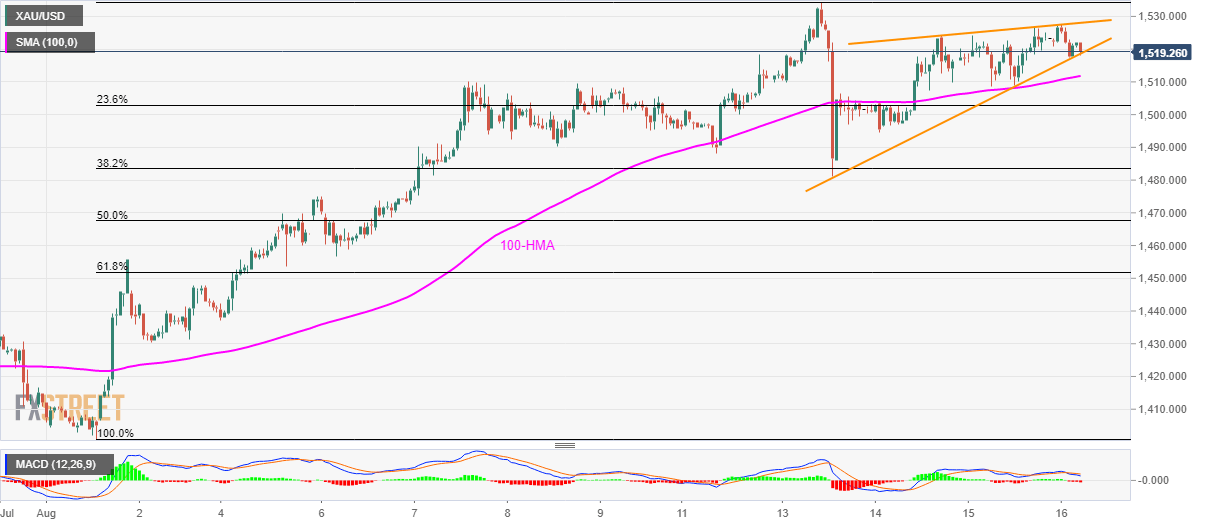
With the 12-bar moving average convergence and divergence (MACD) flashing bearish signals, Gold sellers await confirmation of short-term rising wedge bearish formation to target 100-hour moving average (HMA). The quote currently trades around $1519 ahead of Friday’s European sellers.
While a break of $1518.60 will confirm the bearish technical pattern, 100-HMA at $1,511 can offer an intermediate halt before dragging prices to 23.6% Fibonacci retracement level of present month upside, at $1502.
Should buyers fail to return, August 14 low near $1,494 and August 13 low around $1,481 get to come back as quotes.
Alternatively, $1,528 acts as the formation resistances and a break of which will negate the bearish technical pattern, which in turn can trigger fresh upside towards the recent high of $1,534.41.
Gold hourly chart
Trend: Pullback expected
