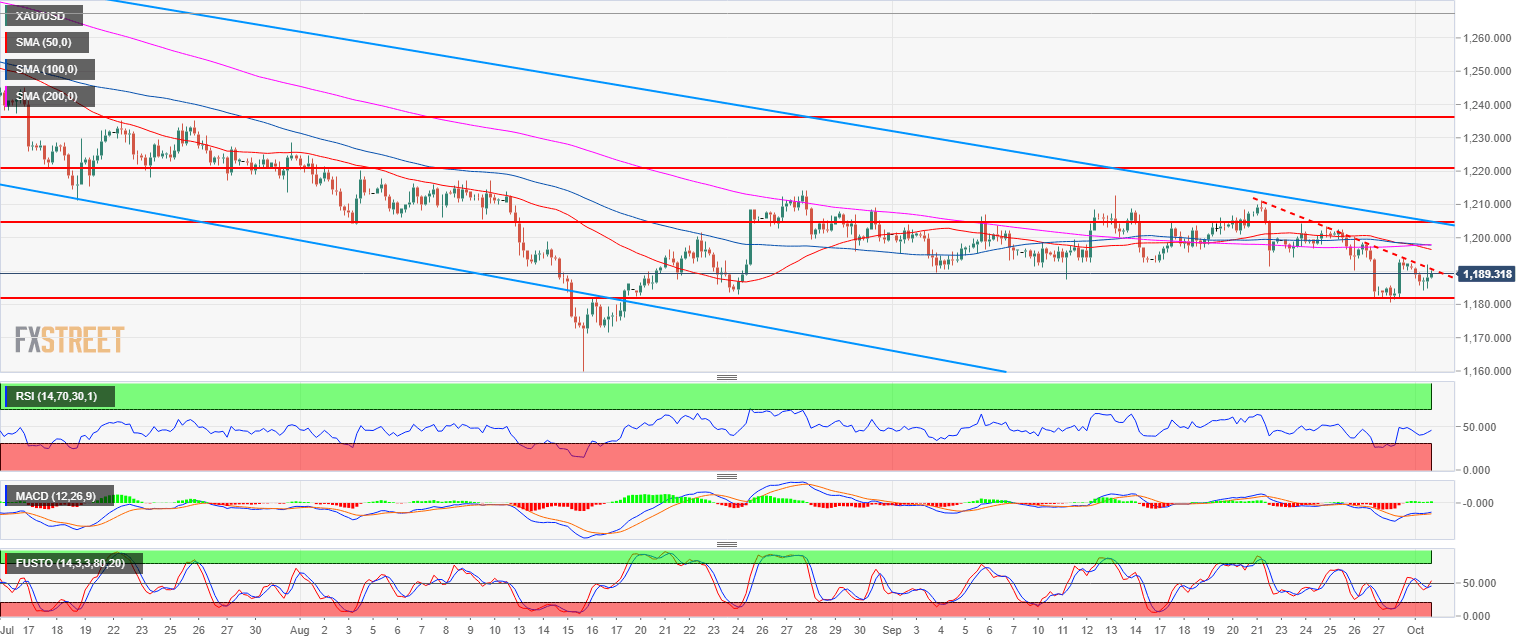
- Gold is in a bear trend as it is trading below its 50, 100 and 200-period simple moving average.
- Gold is trapped in a range between 1,180.00 and $1,210.00 a troy ounce. The yellow metal is currently rebounding from the 1,180.00 level and is challenging a bear trendline (red) while the RSI, MACD and Stochastics are supportive of higher prices.
- If bulls keep the momentum going it can lead to the 1,200.00 figure near the SMA cluster. However, a bear breakout below 1,182.90 August 24 low would likely lead to a continuation of the bear trend.
Gold 4-hour chart
Spot rate: 1,190.00
Relative change: -0.25%
High: 1,192.41
Low: 1,184.30
Main trend: Bearish
Resistance 1: 1,189.49 September 4 low
Resistance 2: 1,194.30 March 10, 2017 low
Resistance 3: 1,204.10, August 3 swing low (key level)
Resistance 4: 1,211.17 July 19 low
Resistance 5: 1,214.30 August 28 high
Resistance 6: 1,217.89-1,220.90 zone, August 6 high and July 18 low
Resistance 7: 1,225.90 July 17 low
Resistance 8: 1,237.60 July 3 swing low
Support 1: 1,182.90 August 24 low
Support 2: 1,172.82 current 2018 low
Support 3: 1,145.20 March, 1 2017 low
