“¢ The precious metal has been trending lower since the New-York trading session on Tuesday alongside a downward sloping trend-channel on the 30-min chart.
“¢ The recent USD upsurge remained uninterrupted and was seen as one of the key factors exerting some heavy downward pressure on the dollar-denominated commodity.
“¢ The commodity’s inability to attract any buying interest clearly suggests that the near-term bearish trajectory might still be far from being over.
“¢ However, highly oversold conditions on hourly/daily/weekly charts might turn out to be the only factor, which might help ease the prevailing bearish pressure.
Gold 30-min chart
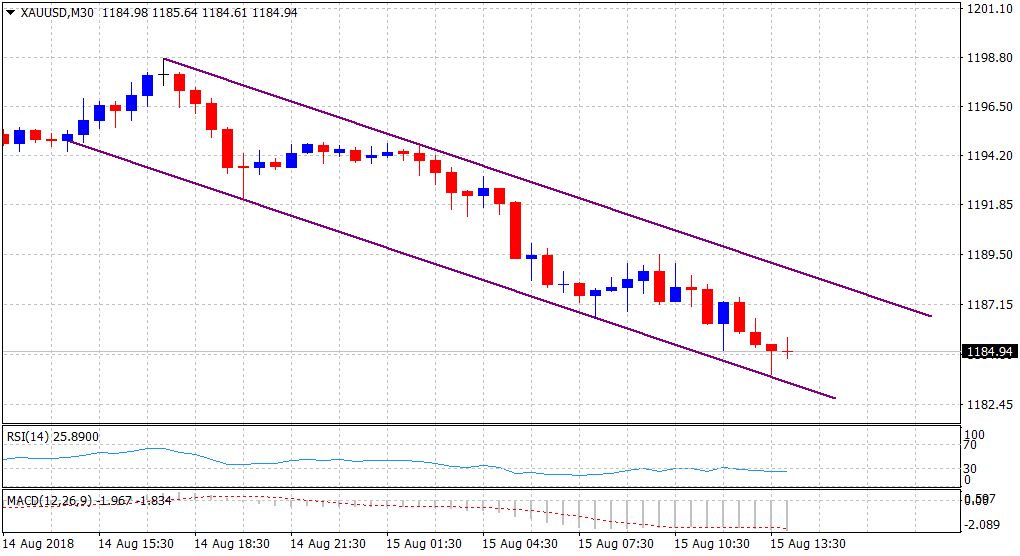
Spot Rate: $1185
Daily High: $1195
Trend: Bearish with prospects of a near-term bounce
Resistance
R1: $1188 (horizontal zone)
R2: $1195 (current day swing high)
R3: $1200 (psychological round figure mark)
Support
S1: $1181 (Jan. 27, 2017 swing low)
S2: $1177 (Jan. 11, 2017 swing low)
S3: $1172 (horizontal zone)
