“¢ The commodity falls to fresh YTD lows and was being weighed down by a combination of negative factors – broad-based USD strength, Fed rate hike expectations, risk-on mood.
“¢ The downfall has been alongside a downward sloping trend-channel formation on the daily chart and points to a continuation of the bearish trajectory.
“¢ With short-term technical indicators gradually drifting towards near-term oversold conditions, bears are likely to pause near the trend-channel support, also coinciding with 200-week SMA.
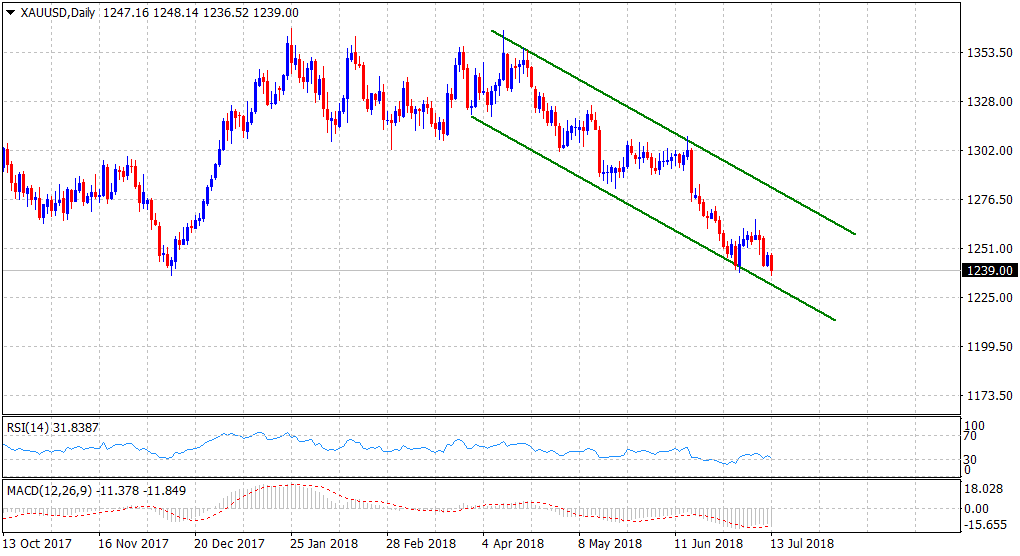
Spot rate: 1238.29
Daily High: 1248.14
Daily Low: 1236.52
Trend: Bearish
Resistance
R1: $1241 (horizontal level)
R2: $1248 (current day swing high)
R3: $1252 (previous YTD weekly closing low)
Support
S1: $1236.52 (current day swing low)
S2: $1234 (200-week SMA/descending trend-channel)
S3: $1229 (horizontal level)
