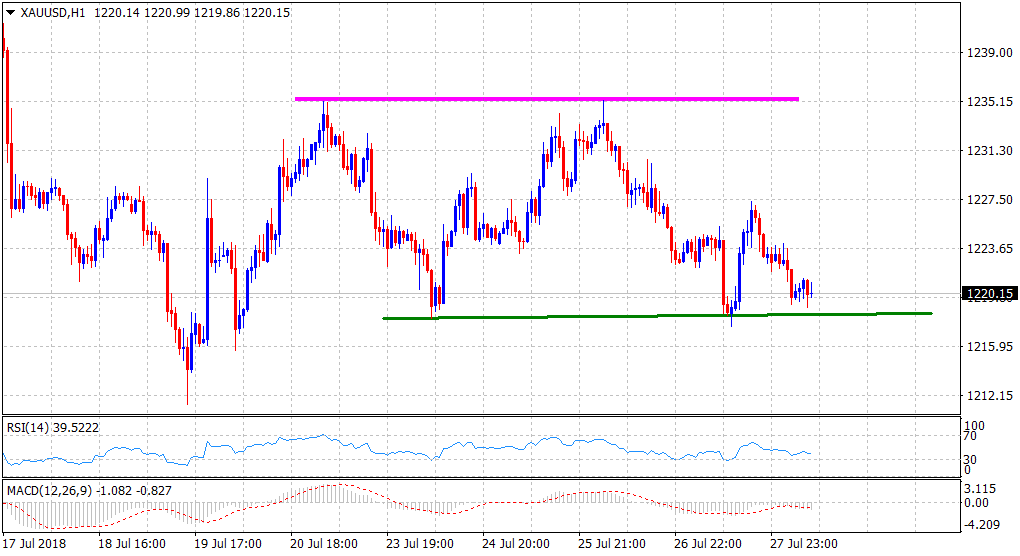
“¢ The commodity extended last week’s rejection slide from $1235 horizontal resistance and remains within striking distance of an important horizontal support.
“¢ A convincing break below the mentioned horizontal support would confirm a bearish double-top chart pattern on the 1-hourly chart and pave the way for the additional near-term downfall.
“¢ Technical indicators on the said chart hold in bearish territory and hence, a follow-through weakness, possibly back towards YTD lows, remains a distinct possibility.
Spot rate: $1220
Daily High: $1224
Trend: Bearish
Resistance
R1: $1224 (current day swing high)
R2: $1231 (horizontal zone)
R3: $1235 (double-top supply zone)
Support
S1: $1217-18 (Friday’s swing low)
S2: $1212 (YTD low set on July 19)
S3: $1205 (July 2017 swing low)

