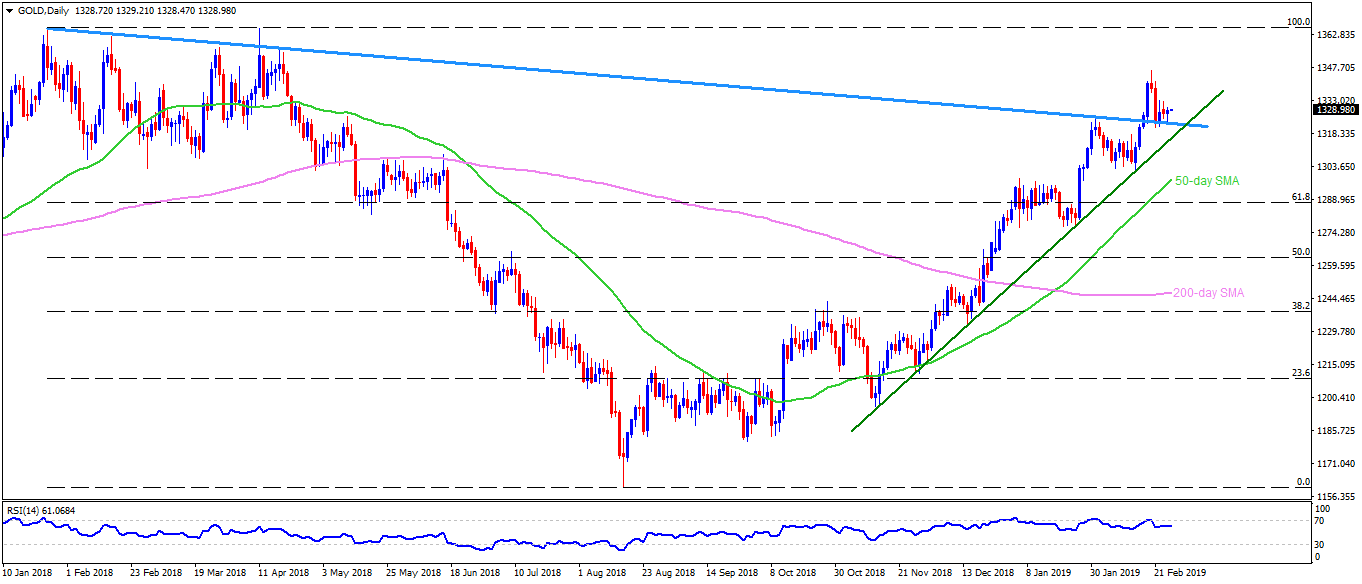
- Gold trades a shade lower than the $1330 during the early Asian session on Wednesday.
- On Tuesday, the bullion bounced off the thirteen-month-old descending trend-line support, previously acting as a resistance.
- Considering the recent U-turn and a gradual increase in 14-day relative strength index (RSI), the quote is likely to revisit $1334, $1337 and $1346 nearby resistances.
- In case buyers continue dominating past-$1346, $1357, $1362 and $1366 might appear on their radar.
- Given the precious metal’s slide under $1322 support-line, an upward sloping trend-line at $1316 that joins lows marked since November 2018 becomes crucial for the traders.
- Should there be a daily closing under $1316, $1302 and 50-day simple moving average (SMA) figure of $1297.85 may please the sellers.
Gold daily chart
XAU/USD
Overview:
Today Last Price: 1328.81
Today Daily change: 1.69 pips
Today Daily change %: 0.13%
Today Daily Open: 1327.12
Trends:
Daily SMA20: 1319.06
Daily SMA50: 1295.9
Daily SMA100: 1261.29
Daily SMA200: 1234.89
Levels:
Previous Daily High: 1332.58
Previous Daily Low: 1325.32
Previous Weekly High: 1346.85
Previous Weekly Low: 1320.72
Previous Monthly High: 1326.25
Previous Monthly Low: 1275.9
Daily Fibonacci 38.2%: 1328.1
Daily Fibonacci 61.8%: 1329.81
Daily Pivot Point S1: 1324.11
Daily Pivot Point S2: 1321.09
Daily Pivot Point S3: 1316.85
Daily Pivot Point R1: 1331.36
Daily Pivot Point R2: 1335.6
Daily Pivot Point R3: 1338.62
