“¢ Hasn’t been able to build on this week’s goodish rebound from YTD lows and is now confined in a downward sloping trend-channel, forming a bullish flag on the 1-hourly chart.
“¢ Short-term technical indicators have started losing their positive momentum but the fact that it has managed to hold above 100-hour SMA reinforces the bullish formation.
“¢ Investors’ attention turns to the keenly watched US monthly jobs report (NFP), which if disappoints should provide the required bullish impetus amid escalating US-China trade war fears.
Gold 1-hourly chart
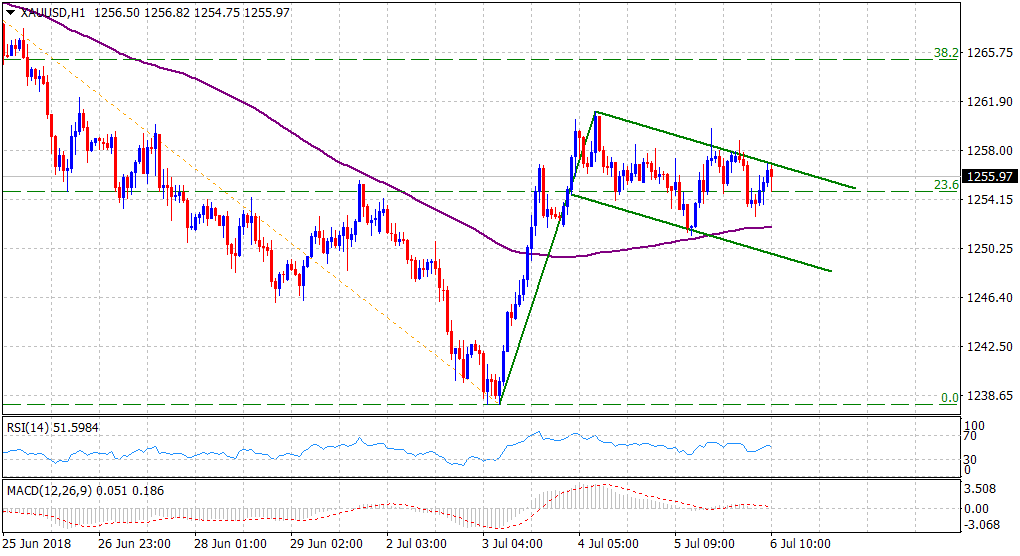
Spot Rate: $1255.97
Daily Low: $1252.83
Daily High: $1258.79
Trend: Slightly bullish
Resistance
R1: $1261 (Wednesday’s one-week high)
R2: $1267 (horizontal zone)
R3: $1272 (medium-term ascending trend-line support break-point)
Support
S1: $1252 (100-period SMA H1)
S2: $1249 (H1 descending trend-channel support)
S3: $1242 (multi-month daily closing low set on Monday)
