- Gold has been trading sideways for eight consecutive weeks.
- Gold is now attempting to breakout from the 1,180.00-$1,210.00 a troy range. The RSI, MACD and Stochastics indicators are constructive for more upside.
- Targets for bulls can be seen near 1,220.90 (July 18 low) and 1,237.60 (July 3 swing low). A failed breakout above 1,211.17 would invalidate the bullish bias and send Gold back into its current range.
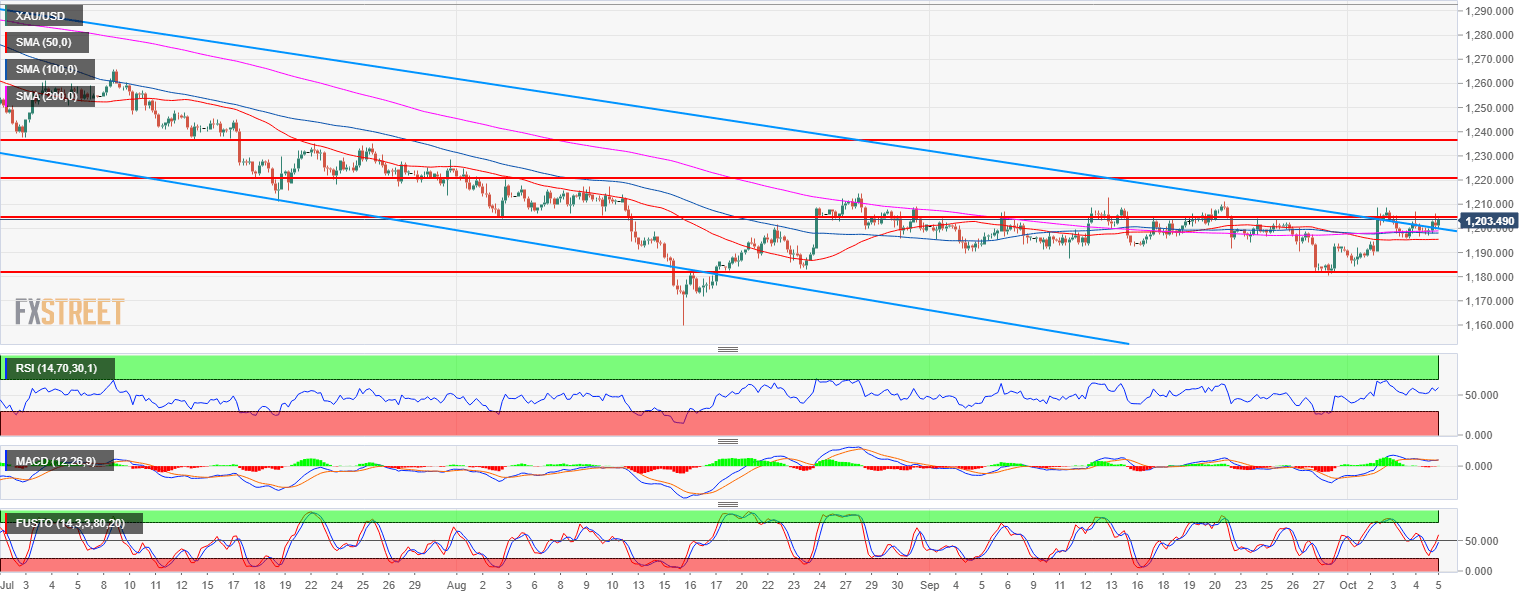
Spot rate: 1,203.40
Relative change: 0.33%
High: 1,206.00
Low: 1,196.90
Main trend: Bearish
Short-term trend: Bullish
Resistance 1: 1,204.10, August 3 swing low (key level)
Resistance 2: 1,211.17 July 19 low
Resistance 3: 1,214.30 August 28 high
Resistance 4: 1,217.89-1,220.90 zone, August 6 high and July 18 low
Resistance 5: 1,225.90 July 17 low
Resistance 6: 1,237.60 July 3 swing low
Support 1: 1,194.30 March 10, 2017 low
Support 2: 1,189.49 September 4 low
Support 3: 1,182.90 August 24 low
Support 4: 1,172.82 current 2018 low
Support 5: 1,145.20 March, 1 2017 low
