“¢ The precious metal built on its recent bullish trajectory from six-week lows and continued gaining traction on Wednesday, marking the third day of positive momentum in the previous four.
“¢ The overnight sustained move above a confluence resistance – comprising of 200-hour SMA and 23.6% Fibo. level of the $1347-$1280 recent downfall was seen as a key trigger for bullish traders.
“¢ The fact that the commodity has found acceptance above 38.2% Fibo. level support prospects for further up-move, though slightly overbought conditions on hourly charts might cap gains.
“¢ Meanwhile, oscillators on the daily chart have just started gaining positive momentum and might prompt dip-buying interest for a move towards 50% Fibo. level around the $1313-14 region.
Gold 1-hourly chart
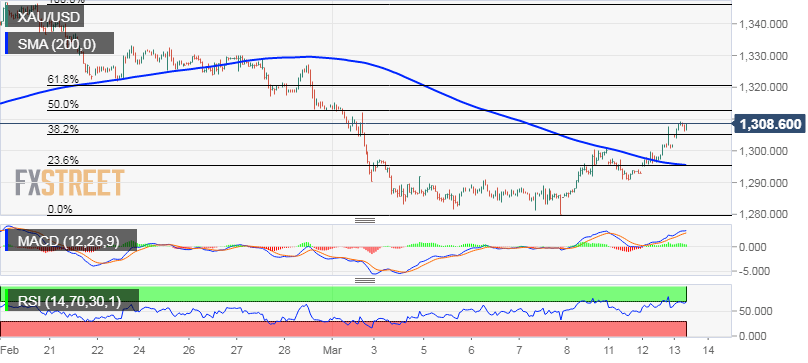
XAU/USD
Overview:
Today Last Price: 1308.16
Today Daily change %: 0.53%
Today Daily Open: 1301.3
Trends:
Daily SMA20: 1311.59
Daily SMA50: 1303.15
Daily SMA100: 1269.06
Daily SMA200: 1238.14
Levels:
Previous Daily High: 1302.15
Previous Daily Low: 1292.97
Previous Weekly High: 1300.7
Previous Weekly Low: 1280.1
Previous Monthly High: 1346.85
Previous Monthly Low: 1300.1
Daily Fibonacci 38.2%: 1298.64
Daily Fibonacci 61.8%: 1296.48
Daily Pivot Point S1: 1295.46
Daily Pivot Point S2: 1289.63
Daily Pivot Point S3: 1286.28
Daily Pivot Point R1: 1304.64
Daily Pivot Point R2: 1307.99
Daily Pivot Point R3: 1313.82
