- Gold struggles between short-term key technical indicators.
- Bearish MACD favors the Bullion’s downside, 23.6% Fibonacci retracement adds to the rest-points.
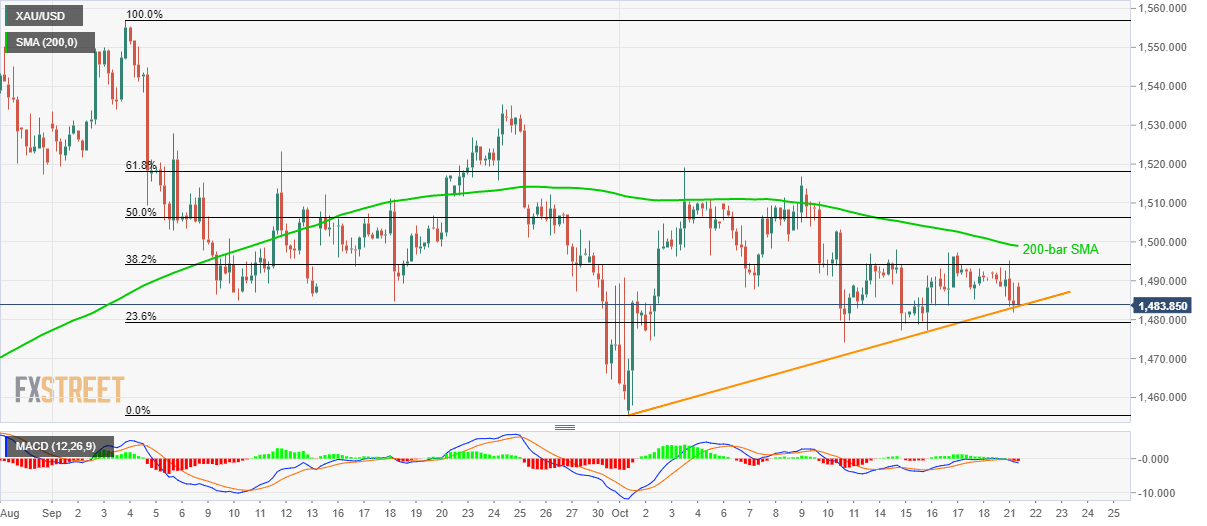
- Upside clearance of 200-bar SMA highlights 61.8% Fibonacci retracement level to buyers.
Gold’s repeated failures to cross 200-bar Simple Moving Average (SMA) fails to portray the yellow metal’s weakness as the monthly trend line limits its downside. The Bullion presently tests the support line while flashing $1,483.55 as a quote amid Tuesday’s Asian session.
Adding to the odds favoring downside is the bearish signal from the 12-bar Moving Average Convergence and Divergence (MACD) indicator.
However, 23.6% Fibonacci retracement of September-October declines, at $1,479 could question the price drop, a break of which highlights the importance of $1,475/74 area including early-month lows.
In a case bears dominate below $1,474, the monthly bottom near to $1,455 will be on their radars.
Alternatively, upside break of 200-bar SMA, at $1,499 now, will trigger fresh run-up to 61.8% Fibonacci retracement level of $1,518 whereas late-September high around $1,535 could lure bulls afterward.
Gold 4-hour chart
Trend: sideways
