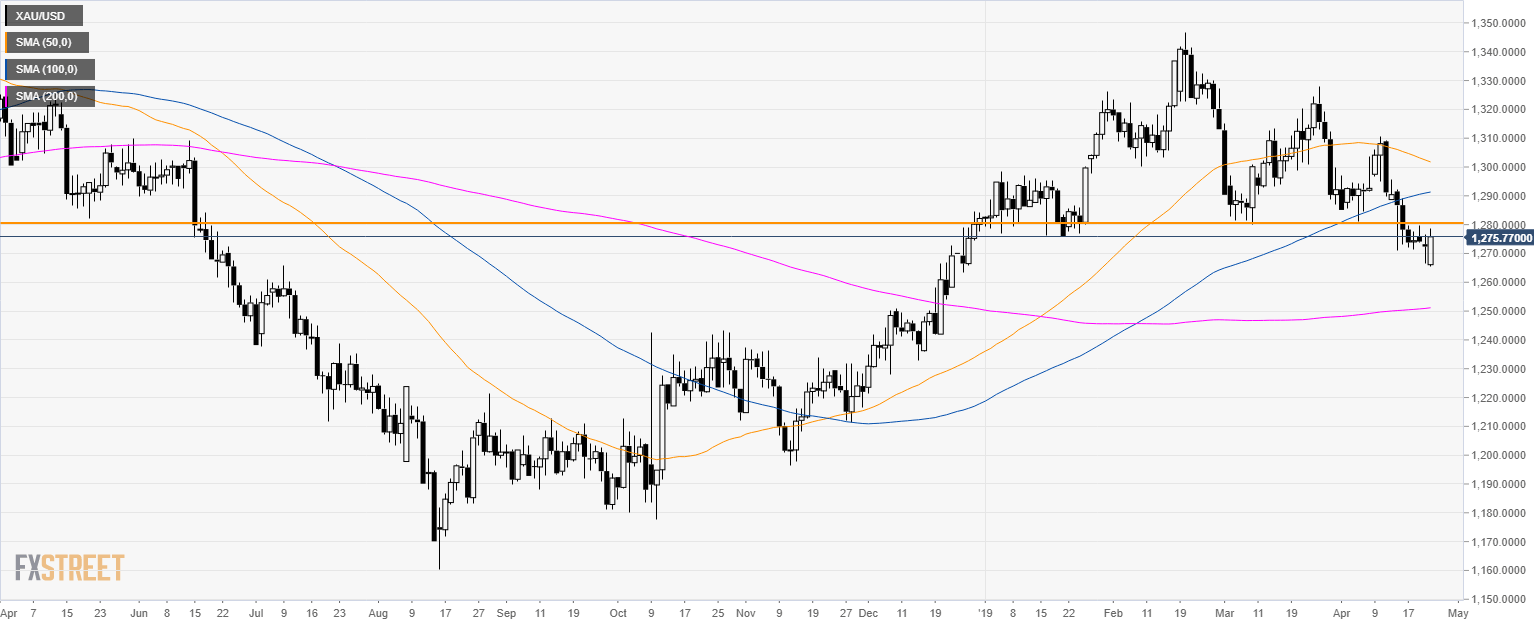
Gold daily chart
- The yellow metal corrected part of the slide of the last weeks this Wednesday but found strong resistance at the 1,280.00 level.
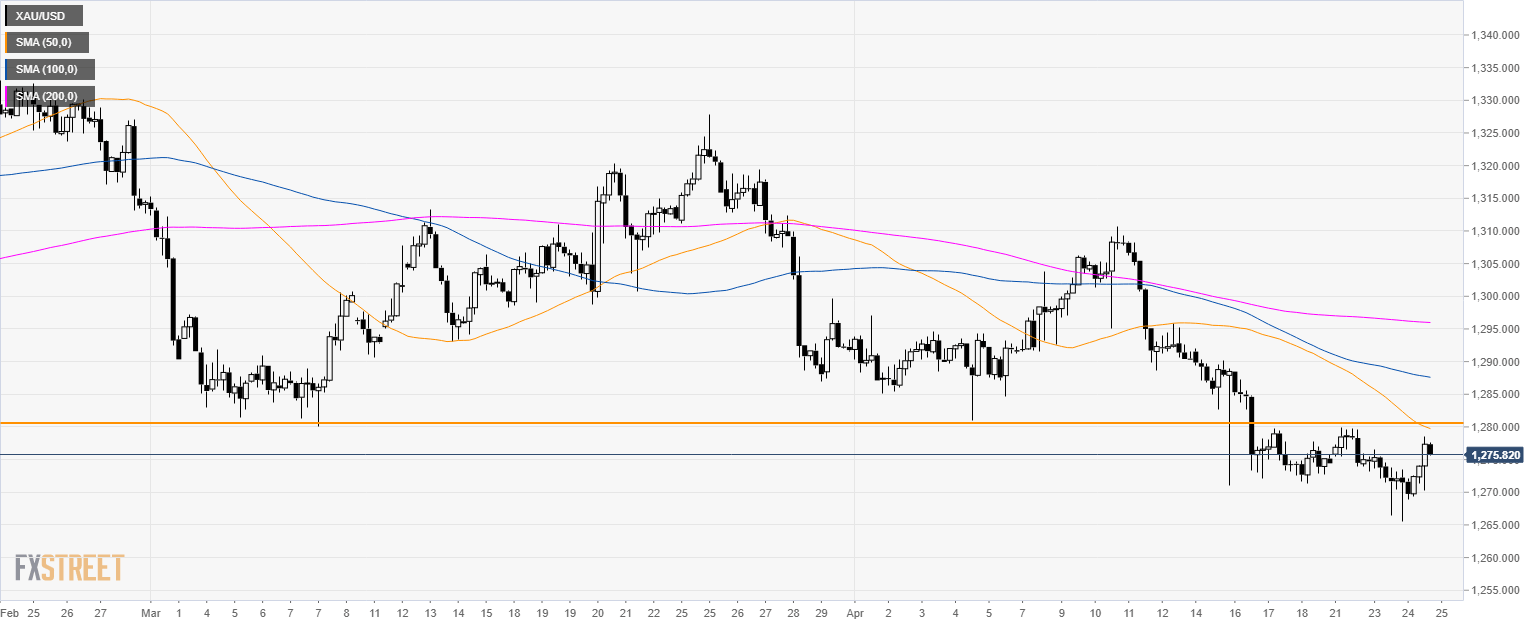
Gold 4-hour chart
- Gold is trading below its main SMAs suggesting a bearish bias in the medium-term.
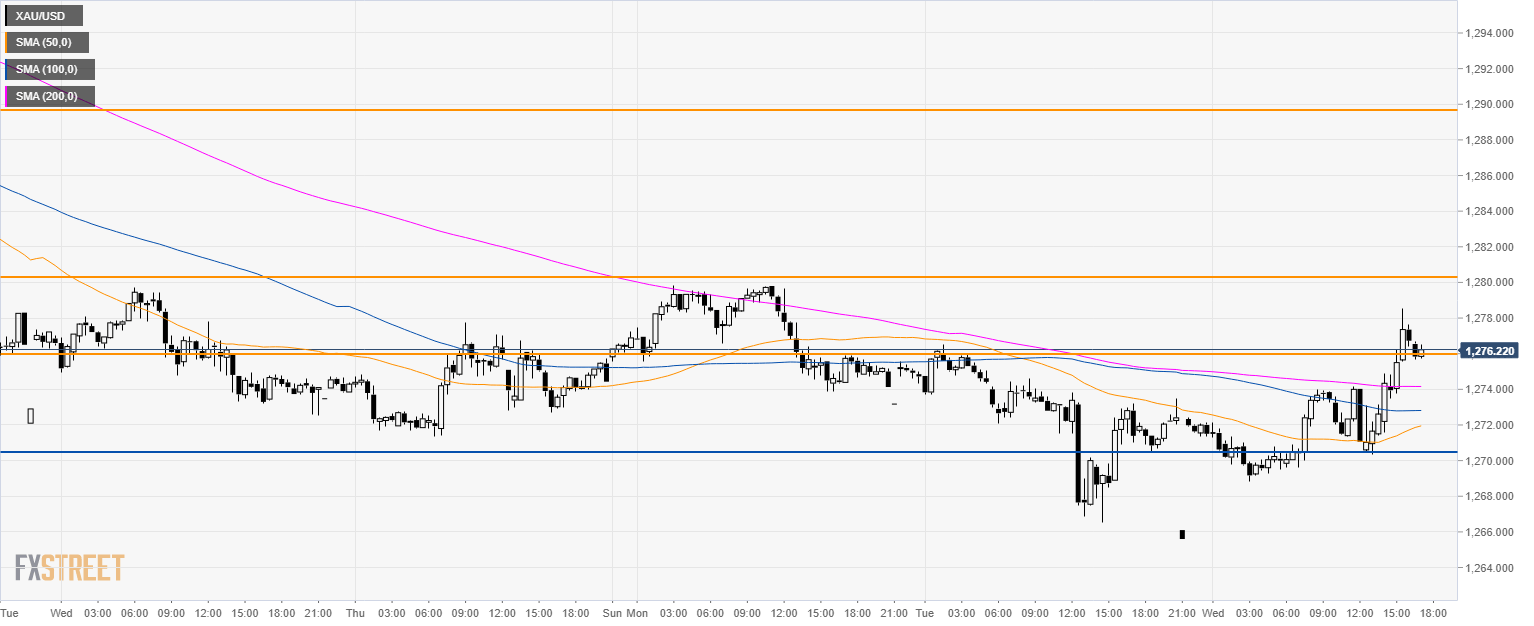
Gold 30-minute chart
- Gold is trading above its main SMAs suggesting a bullish correction in the short-term.
- Bulls will defend 1,270.00 level while bears will try to break below it to reach 1,260.00 and 1,247.00 support to the downside.
- Key resistance is at 1,280.00 and then at 1,290.00 figure.
Additional key levels
