- Gold (XAU/USD) hourly chart shows the upside break of a falling channel.
- A corrective rally will likely gather steam if metal finds acceptance above the 50-hour moving average.
- The long-run outlook remains bearish, the metal looks set to test $1,240.
Hourly chart
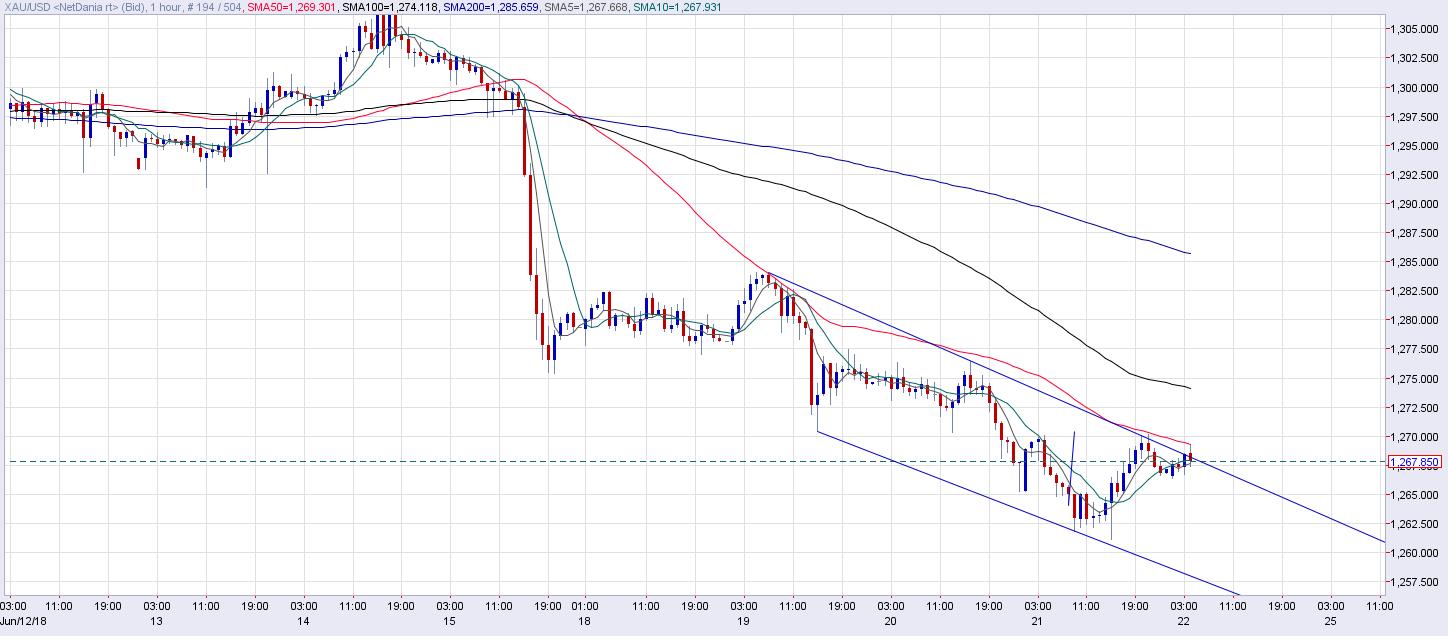
Chart source: Netstation
Current Price: $1,267
Daily High: $1,269
Daily Low: $1,266
Trend: Corrective rally likely
Resistance
R1: $1,269.30 (50-hour MA)
R2: $1,274.12 (100-hour MA)
R3: $1,282 (May 21 low)
Support
S1: $1,261.14 (previous day’s low)
S2: $1,240 (double top breakdown target)
S3: $1,236.45 (Dec. 12 low)
