- Gold is on track to report its biggest monthly loss since August 2018.
- Gold is on the defensive with the daily chart reporting a bearish setup.
Gold is currently trading at $1,493 per Oz, representing a 1.8% drop from Sept. 1’s opening price of $1,523.
That is the biggest monthly loss since August 2018. Back then, the yellow metal had dropped by 1.82%. Also, Gold shed 2.29% in July 2018.
The metal may close well below $1,490 and register its biggest loss since July 2018, as the daily chart shows the 14-day relative strength index (RSI) has dipped below 50 and the MACD histogram is again producing deeper bars below the zero line, indicating a strengthening of bearish momentum.
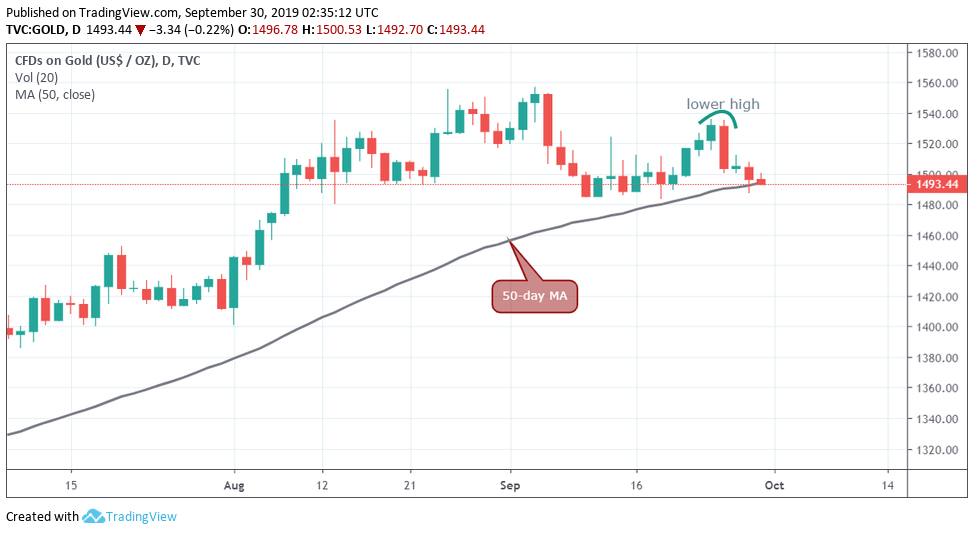
Also, Gold created a bearish lower high at $1,536 last week and is now trading below the 50-day moving average (MA) support of $1,494.
Daily chart
Trend: Bearish
Technical levels
