- Gold seesaws near $1,491.
- 21-day EMA limits immediate upside amid bearish MACD.
Despite its sustained trading below 21-day EMA, gold prices stay modestly changed around $1,491 during the early Asian session on Monday.
The yellow metal clings to 38.2% Fibonacci retracement of July-September upside with the bearish signal from 12-bar Moving Average Convergence and Divergence (MACD) and extended trading under 21-day Exponential Moving Average (EMA) favoring sellers.
In doing so, a monthly trend line, at $1,483, acts as immediate key support ahead of 50% Fibonacci retracement level of $1,469.
It should, however, be noted that the quote’s further declines below $1,469 will be questioned by $1,455.50-$1,453 area including multiple lows since August 06 and 100-day EMA.
Meanwhile, a daily closing beyond a 21-day EMA level of $1,495.62 can trigger fresh run-up to six-week-old falling resistance line, at $1,509.
During the pair’s successful break above $1,509, late-September highs close to $1,535 will be the key to watch.
Gold daily chart
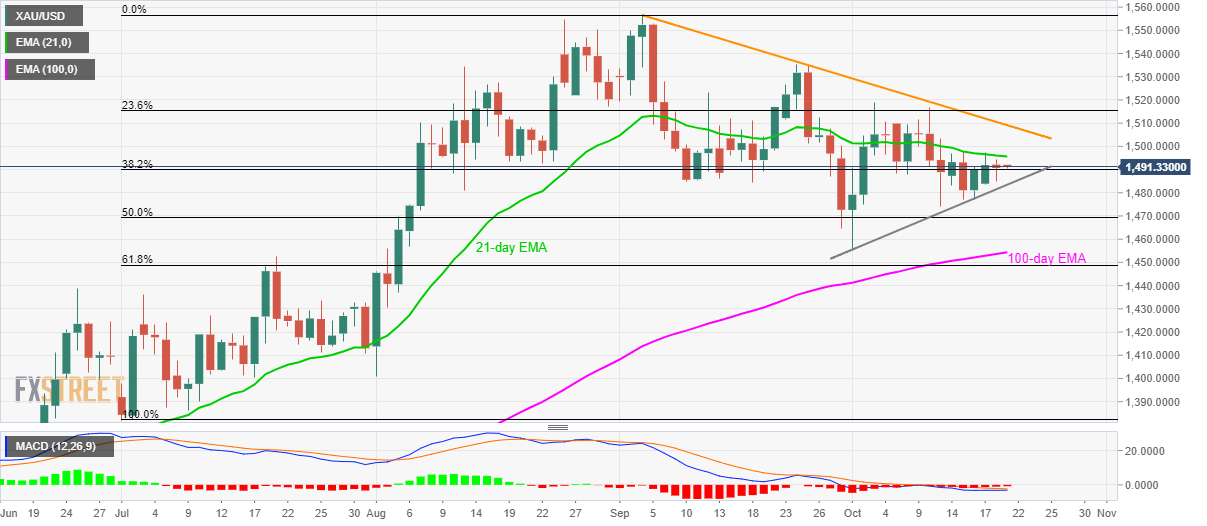
Trend: bearish
