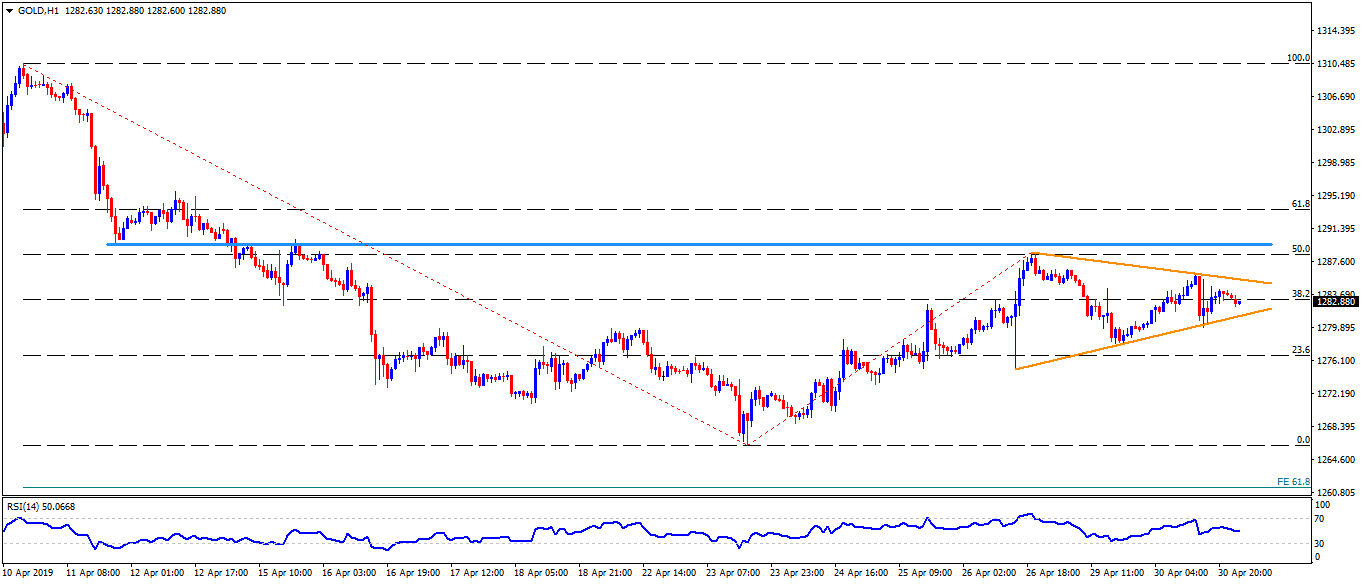
- Short-term symmetrical triangle limits the moves ahead of $1290 horizontal resistance.
- The nine-month-old trend-line at $1266 continues to be strong downside support.
Gold is taking the rounds near $1283 during the early Asian session on Wednesday. The yellow metal has been following a symmetrical triangle technical formation since April 26.
The technical pattern confines the bullion’s moves between $1281 and $1286 with $1290 being an additional resistance to please buyers past-$1286.
Should prices rally beyond $1290, $1296, $1300 and $1306 are likely intermediate halts that can be availed during the quote’s rally towards April month high near $1311.
Alternatively, a downside break of $1281 can trigger fresh selling in direction to $1278, $1273 and $1270 consecutive supports.
Also, April month lows near $1266 join almost nine-month-old upward sloping trend-line and together offers strong support past-$1270, a break of which can recall $1260 level comprising 61.8% Fibonacci expansion (FE) of its previous month moves.
Gold hourly chart
Trend: Sideways
