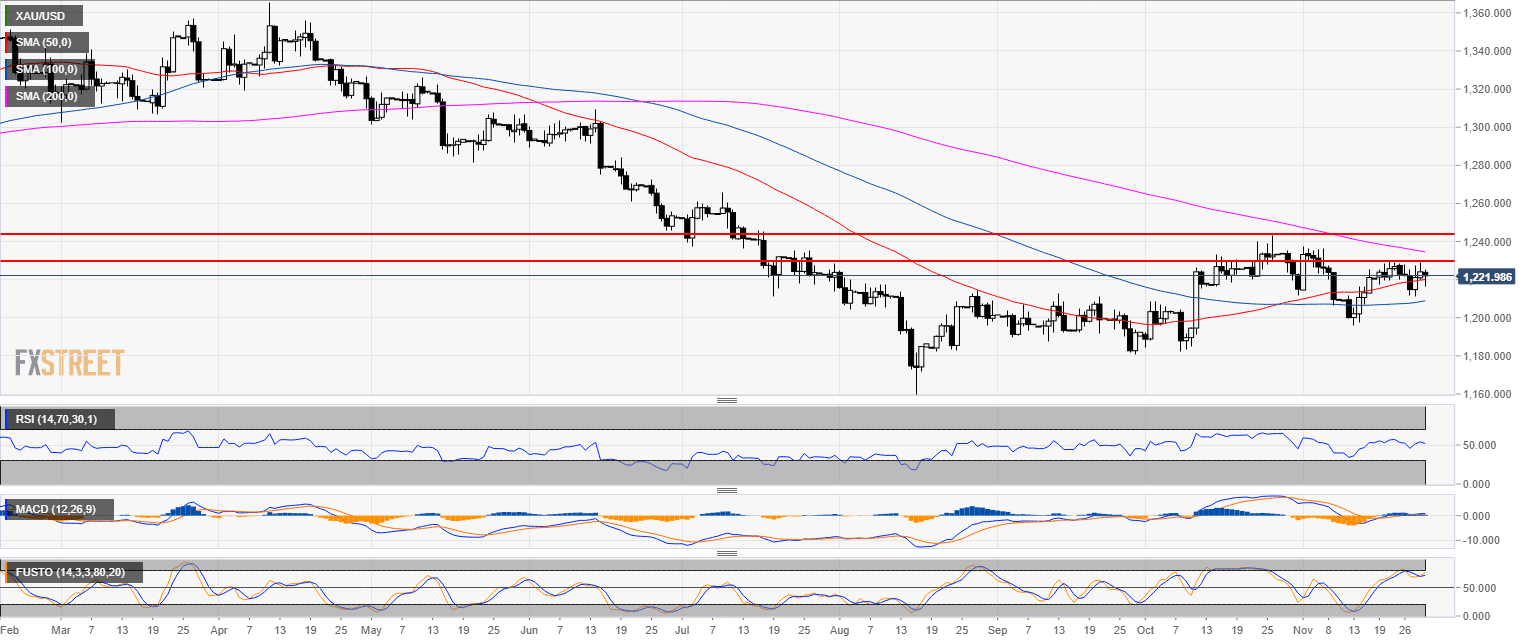
Gold 4-hour chart
- Gold is trading in a bear trend below the 200-day simple moving average.
- Gold bulls objective is to break above 1,230.00 ressitance in order to reach the October highs.
- Technical indicators are supportive of higher prices.
Additional key levels
XAU/USD
Overview:
Today Last Price: 1221.68
Today Daily change: -2.4e+2 pips
Today Daily change %: -0.193%
Today Daily Open: 1224.04
Trends:
Previous Daily SMA20: 1217.42
Previous Daily SMA50: 1219.75
Previous Daily SMA100: 1208.44
Previous Daily SMA200: 1235.01
Levels:
Previous Daily High: 1228.9
Previous Daily Low: 1220.3
Previous Weekly High: 1230.3
Previous Weekly Low: 1217.7
Previous Monthly High: 1243.43
Previous Monthly Low: 1182.54
Previous Daily Fibonacci 38.2%: 1225.62
Previous Daily Fibonacci 61.8%: 1223.59
Previous Daily Pivot Point S1: 1219.93
Previous Daily Pivot Point S2: 1215.82
Previous Daily Pivot Point S3: 1211.34
Previous Daily Pivot Point R1: 1228.53
Previous Daily Pivot Point R2: 1233.01
Previous Daily Pivot Point R3: 1237.12
