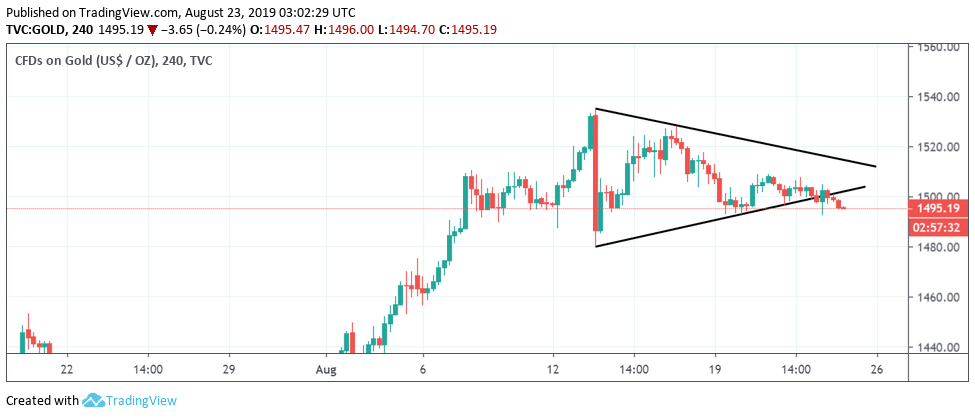
- Gold has dived out a symmetrical triangle pattern on the 4-hour chart.
- The daily chart indicators also favor a drop to $1,480.
Gold is currently trading at $1,496 per Oz, representing 0.22% losses on the day.
On the 4-hour chart, the yellow metal has dived out of a narrowing price range or contracting triangle pattern.
Essentially, sellers have come out victorious in a tug of war with the bulls.
The indicators on the daily chart are also biased bearish. For instance, the moving average convergence divergence (MACD) histogram has crossed below zero, confirming a bearish reversal. The 5-and 10-day moving averages (MAs) have also produced a bearish crossover.
So, a deeper drop to the Aug. 13 low of $1,480. The bearish case would weaken if prices rise above $1,508, although, as of writing, that looks unlikely.
4-hour chart
Trend: Bearish
Pivot points
