“¢ After breaking the December lows support, near the $1240-38 region, the precious metal continued with its steep decline and touched a fresh one-year low on Thursday.
“¢ The ongoing USD upsurge wrecked everything across the board and was seen as one of the key factors smashing dollar-denominated commodities, including gold.
“¢ The bearish pressure now seems to have abated around $1212 level, with further support beneath seen at July 2017 low level of $1204.85 ahead of the $1200 handle.
“¢ Meanwhile, highly oversold conditions on hourly/daily/weekly charts warrant some near-term consolidation or a modest short-covering bounce.
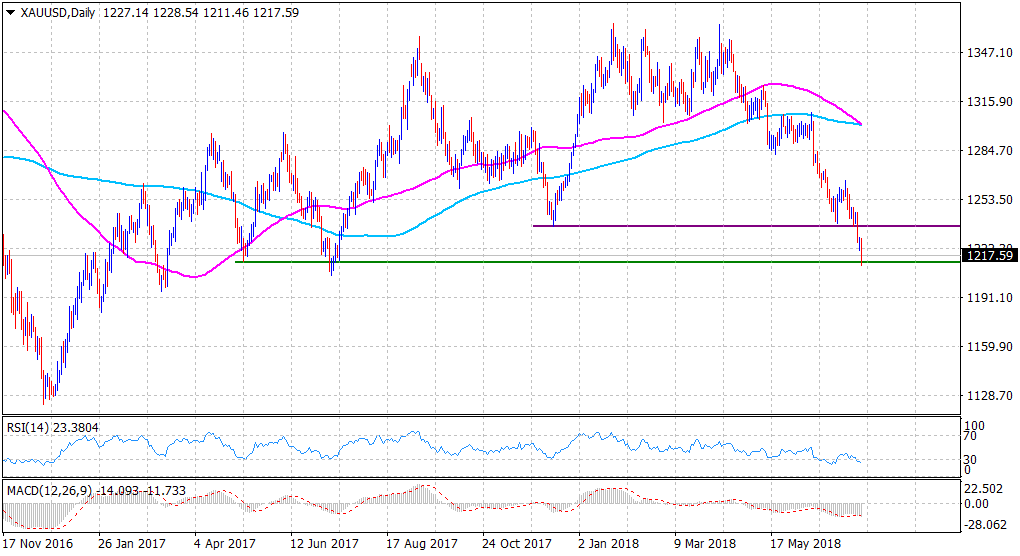
Spot rate: $1217.59
Daily High: $1228.54
Daily Low: $1211.46
Trend: prospects for a minor bounce
Resistance
R1: $1222 (horizontal zone)
R2: $1225 (50-period SMA H1)
R3: $1229 (overnight swing high)
Support
S1: $1211 (one-year low set earlier today)
S2: $1205 (July 2017 swing low)
S3: $1200 (round figure mark)
