- Gold stays under bearish pressure below the 1480 resistance level.
- The level to beat for sellers is the 1445 swing low.
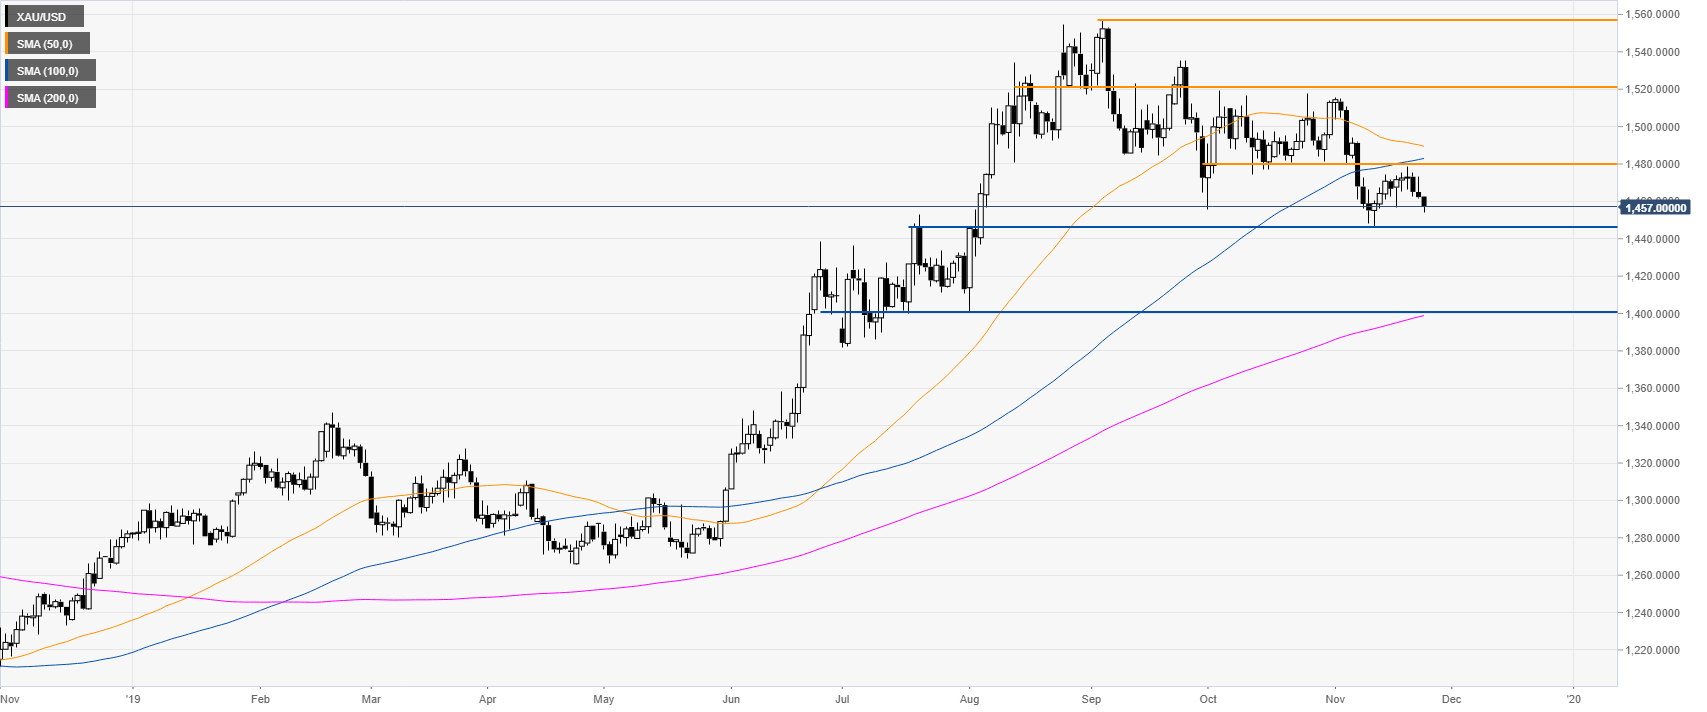
Gold daily chart
Gold is starting the week trading close to its lowest point in 2-months while trading below the 50 and 100 SMAs on the daily chart.
The metal is trading in a bull flag, printing lower lows and lower highs. The $1480 per troy ounce level near the 100 SMA, is the first resistance of relevance.
The bulls are, for the time being, absent and bears are likely looking for a breakdown below the 1445 swing low. If the breakout turns out to be successful, the next main support on the way down can be located near the 1400 handle.
On the flip side, if the market breaks beyond the 1480 resistance level on a daily closing basis, gold could start resuming the underlying bull trend and rise towards the 1520 level.
Additional key levels
