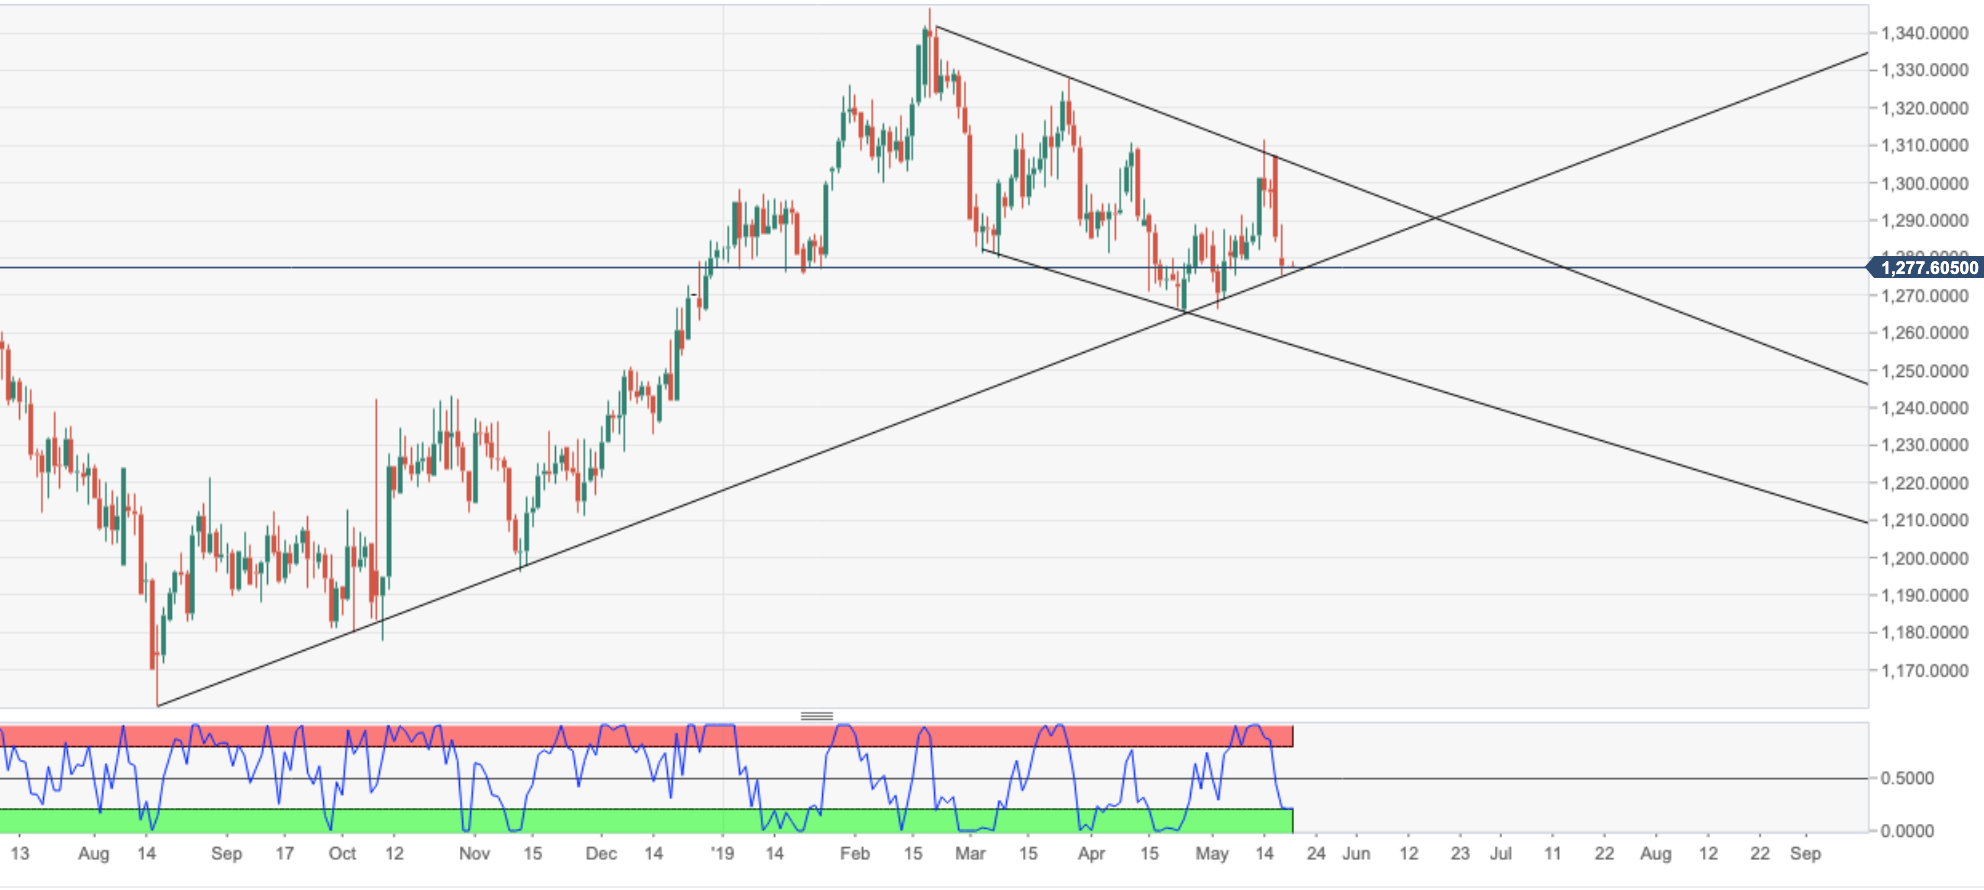
- Technically, the price is below the 50 and 20 DMAs, dropping back from channel resistance with room to go on the RSI to the downside although meeting its mid-April support line.
- The price is now testing the mid-August 2018 major-uptrend’s support line for a third time this month.
- A break of this support will open 1262 and S1.
- On a continuation to the downside, the 200 DMA is located at 1257 while 1251 marks the 10th Dec swing highs (William’s fractal point and target).
- On the flipside, a mean reversion of the recent swing highs to lows meets the 50 DMA at 1289.
- However, the bulls will first need to break the 1281/82 resistance and 23.6% Fibo retracement of the said range which is also the wedge’s resistance point.
- 1286 marks the 21-DMA. 1297 is trend line resistance while 1303 is recent swing fractal high.
 “‹”‹”‹”‹”‹”‹”‹
