- Overbought RSI conditions triggered Gold’s pullback from the multi-year high.
- Two-week-old horizontal support, rising wedge support and 4H 100MA become the key downside levels to watch.
Overbought conditions of 14-bar relative strength index (RSI) drag Gold from multi-year high to $1,535 ahead of Wednesday’s European session.
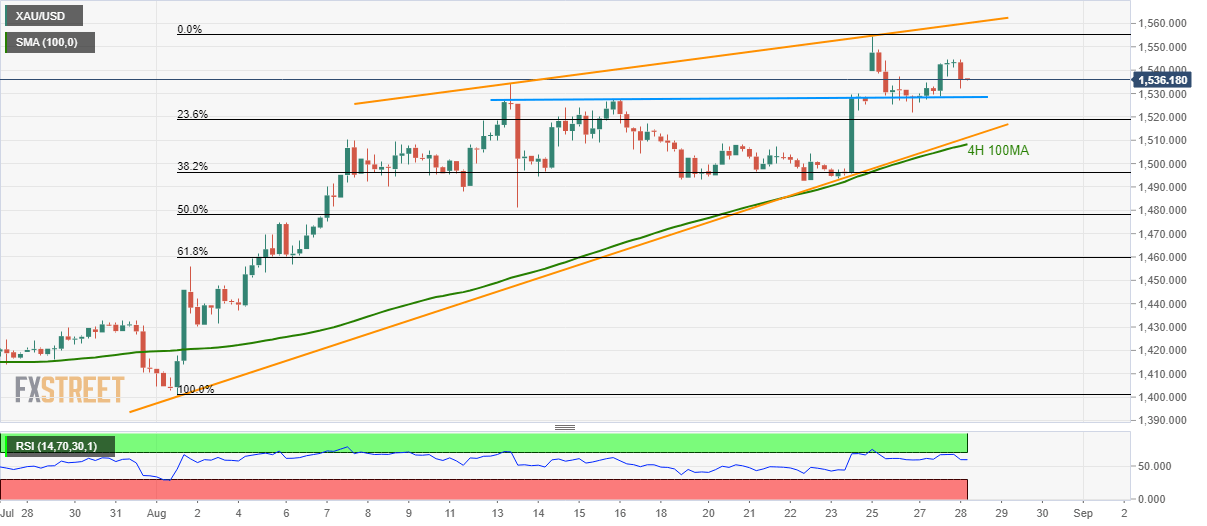
The yellow metal has multiple downside supports to validate the bear’s entry. Among them, a two-week-old horizontal-line surrounding $1,530 becomes the first one, followed by 23.6% Fibonacci retracement of current month upside, at $1,519.
However, $1,511/08 seem to be crucial as it comprising 100-bar simple moving average (4H 100MA) and support-line of a monthly rising wedge bearish formation.
Should prices decline below $1,508, 61.8% Fibonacci retracement level of 1,459 gains market attention.
Meanwhile, $1,545, $1,555 and rising wedge resistance of $1,560 can limit the bullion’s near-term upside, a break of which could escalate the north-run towards $1,600 round-figure.
Gold 4-hour chart
Trend: Pullback expected
