- Gold escalates the week-start rise towards the key near-term resistance.
- Bears will look for entry below 61.8% Fibonacci retracement if overbought RSI conditions are to be believed.
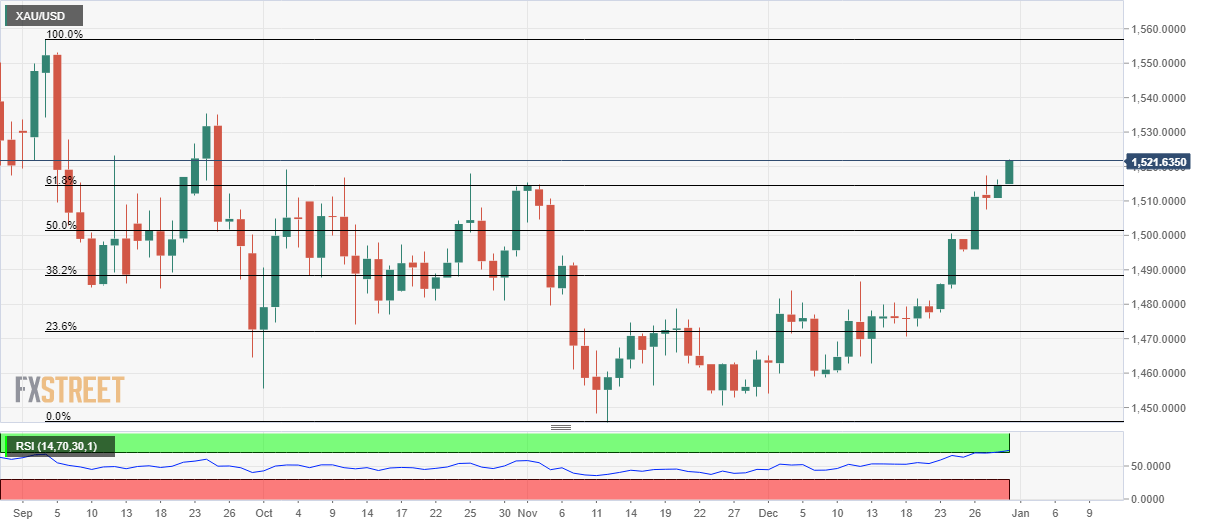
Gold takes the bids to $1,521.50 during the initial trading session on Tuesday. In doing so, the yellow metal successfully breaks 61.8% Fibonacci retracement level of the declines from September to November.
Bulls are now gearing up to confront the September 24 high, near $1,525, ahead of targeting the September month top, at $1,557.
It should also be noted that the Bulls’ dominance past-$1,557 will look towards mid-April 2013 levels near $1,590.
Meanwhile, a daily closing below 61.8% Fibonacci retracement level of $1,514.40 can trigger fresh pullback towards 50% Fibonacci retracement surrounding $1,500 round-figure.
However, the safe-haven’s declines beneath the same will be the call for the Bears’ command targeting early-month tops near $1,484.
Gold daily chart
Trend: Bullish
