- Gold prices struggle to carry the run-up to a multi-year top.
- An eight-month-old rising trend line limits the Bullion’s immediate declines.
- May 2013 top can please buyers during the upside break.
Following its early-day run-up to the fresh high since April 2013, Gold prices seesaw around $1,575 amid Monday’s Asian session.
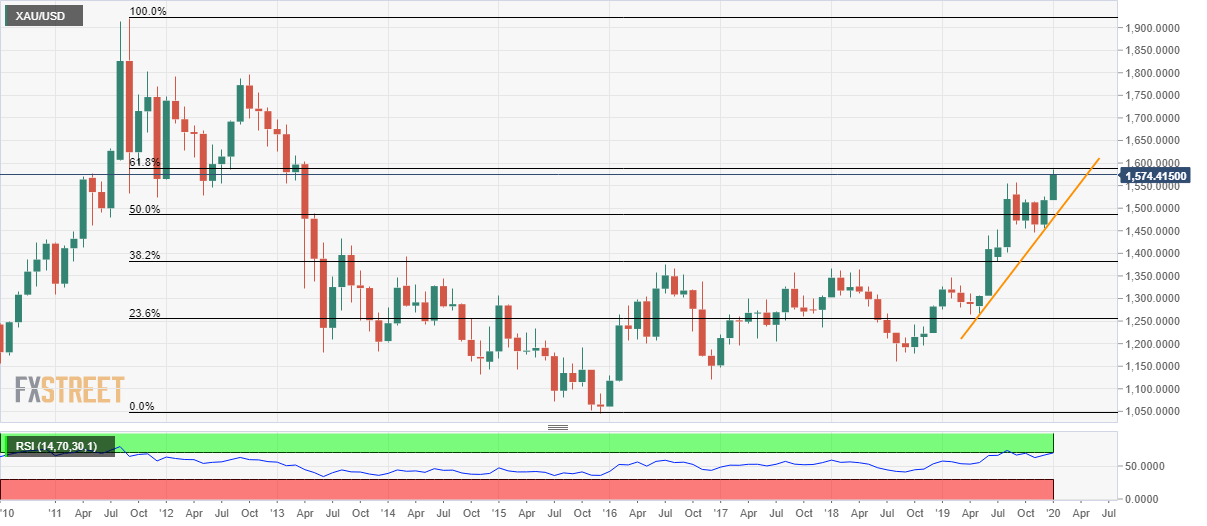
The yellow metal is near to 61.8% Fibonacci retracement of its broad downpour from 2011 high to 2015 low, around $1,589.
However, overbought conditions of RSI are likely to challenge Aussie’s run-up, which if not respected can propel the quote to $1,600 mark. During the safe-haven’s further rise past-$1,600, March 2013 high near $1,616 will be in the spotlight.
Alternatively, an ascending trend line since May 2019, at $1,478 will be the key, a break of which could fetch prices to sub-$1,450 area.
Gold monthly chart
Trend: Pullback expected
