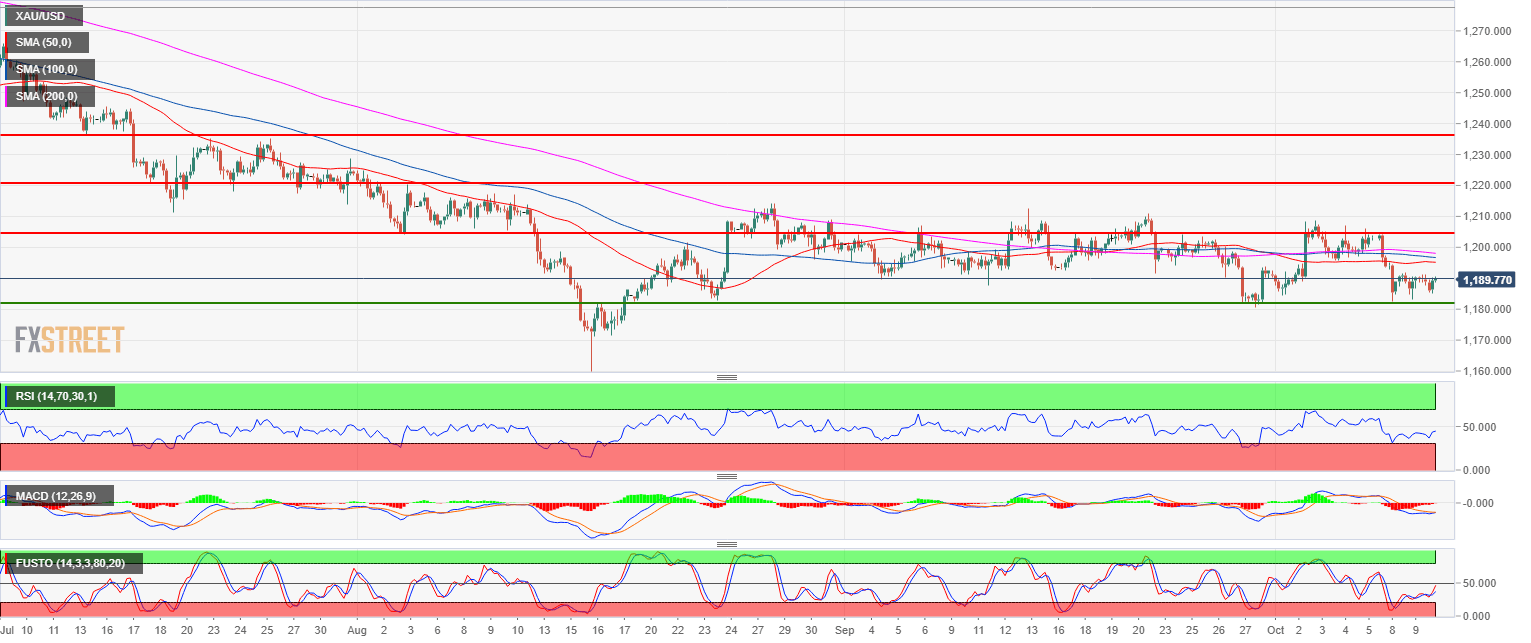
- The Yellow Metal has been trading sideways for nine consecutive weeks.
- Gold is being supported above 1,182.90 support. Gold is keeping the range intact as bulls will try to reach 1,211.17 July 19 low. The RSI, MACD and Stochastic indicators are constructive to the upside.
- However, a bear breakout below 1,182.90 can send gold to 1,172.82 (current 2018 low).
Rate: 1,189.74
Relative change: 0.02%
High: 1,191.41
Low: 1,185.37
Main trend: Bearish
Short-term trend: Bullish
Resistance 1: 1,189.49 September 4 low
Resistance 2: 1,194.30 March 10, 2017 low
Resistance 3: 1,204.10, August 3 swing low (key level)
Resistance 4: 1,211.17 July 19 low
Resistance 5: 1,214.30 August 28 high
Resistance 6: 1,217.89-1,220.90 zone, August 6 high and July 18 low
Resistance 7: 1,225.90 July 17 low
Resistance 8: 1,237.60 July 3 swing low
Support 1: 1,182.90 August 24 low
Support 2: 1,172.82 current 2018 low
Support 3: 1,145.20 March, 1 2017 low
