“¢ Once again fails to breakthrough a bullish flag chart pattern formation on the 1-hourly chart, despite the post-NFP USD weakness and persistent trade war fears.
“¢ With short-term technical indicators starting to lose their positive momentum, repeated rejection at higher levels now seems to suggest a possible retest of 100-hour SMA support.
“¢ A subsequent slid could get extended towards the short-term descending trend-channel (flag) support, which if broken might negate prospects for any further recovery.
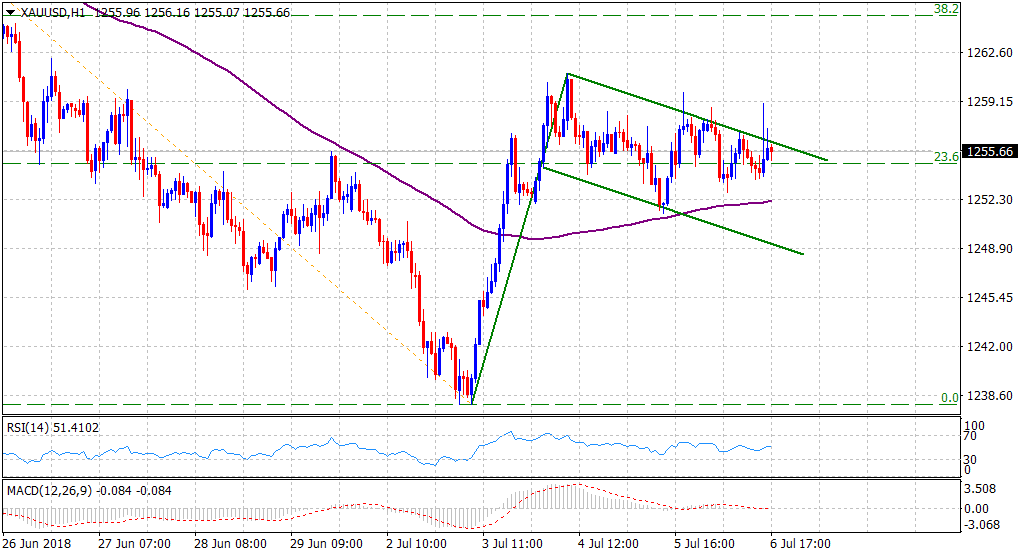
Spot Rate: $1255.66
Daily Low: $1252.83
Daily High: $1259.01
Trend: Sideways
Resistance
R1: $1261 (Wednesday’s one-week high)
R2: $1267 (horizontal zone)
R3: $1273 (50% Fibo. level of the $1309-$1238 downfall)
Support
S1: $1252 (100-period SMA H1)
S2: $1249 (H1 descending trend-channel support)
S3: $1242 (multi-month daily closing low set on Monday)
