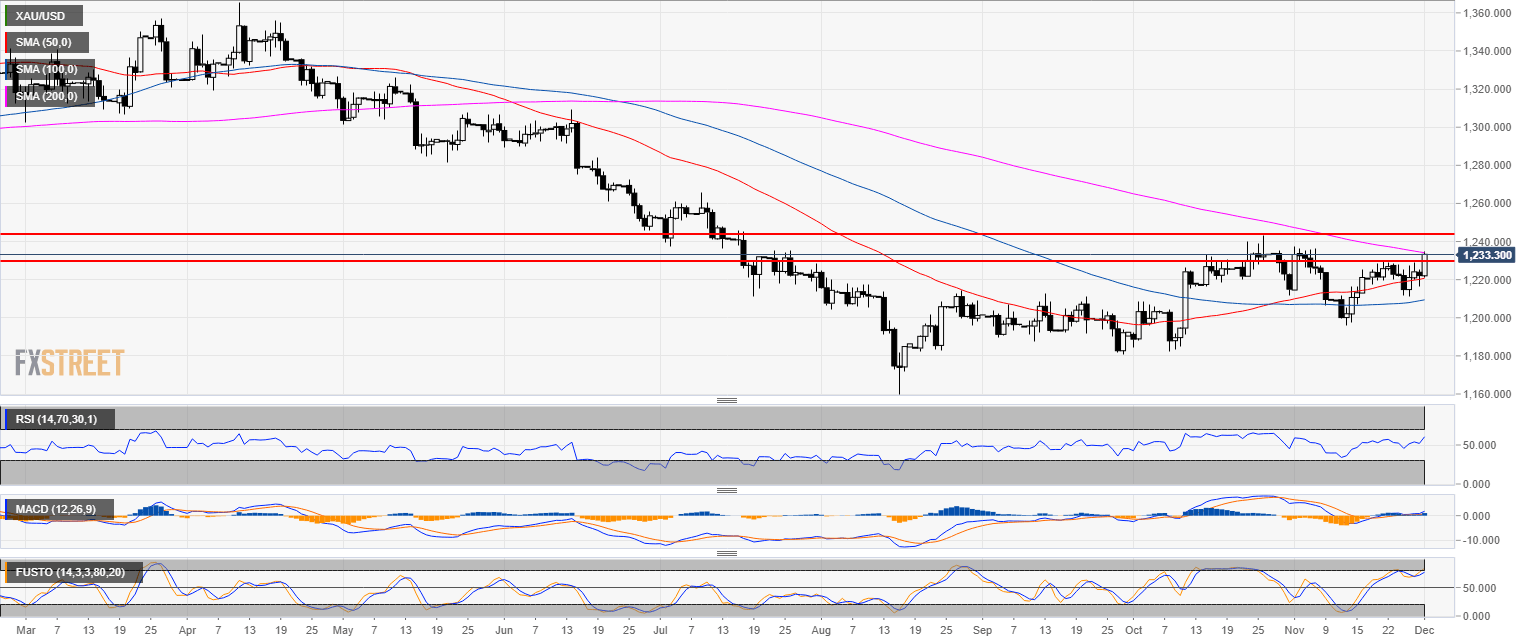
Gold daily chart
- Gold is trading in a bear trend below the 200-day simple moving average.
- Gold is currently testing the 200 SMA.
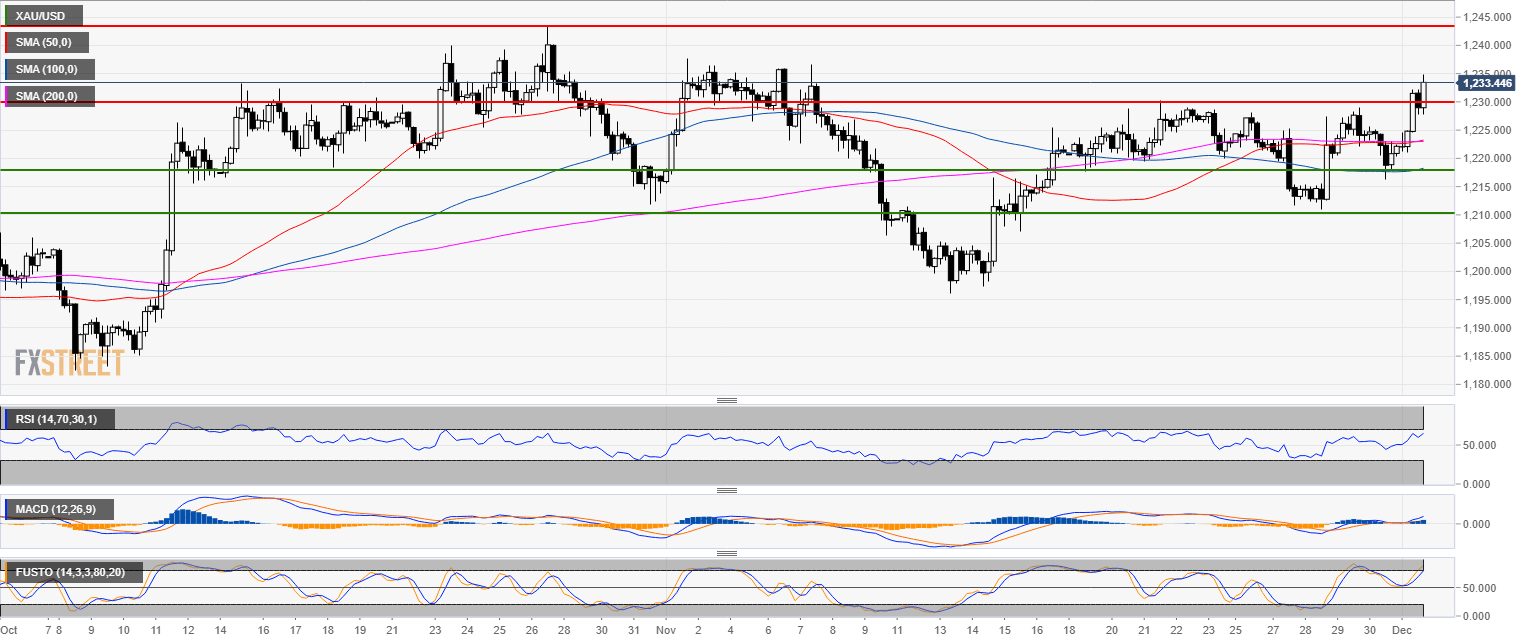
Gold 4-hour chart
- Gold is spiking above the 1230.00 resistance as the market is testing the November highs.
- $1,244.00 seems to be next resistance level.
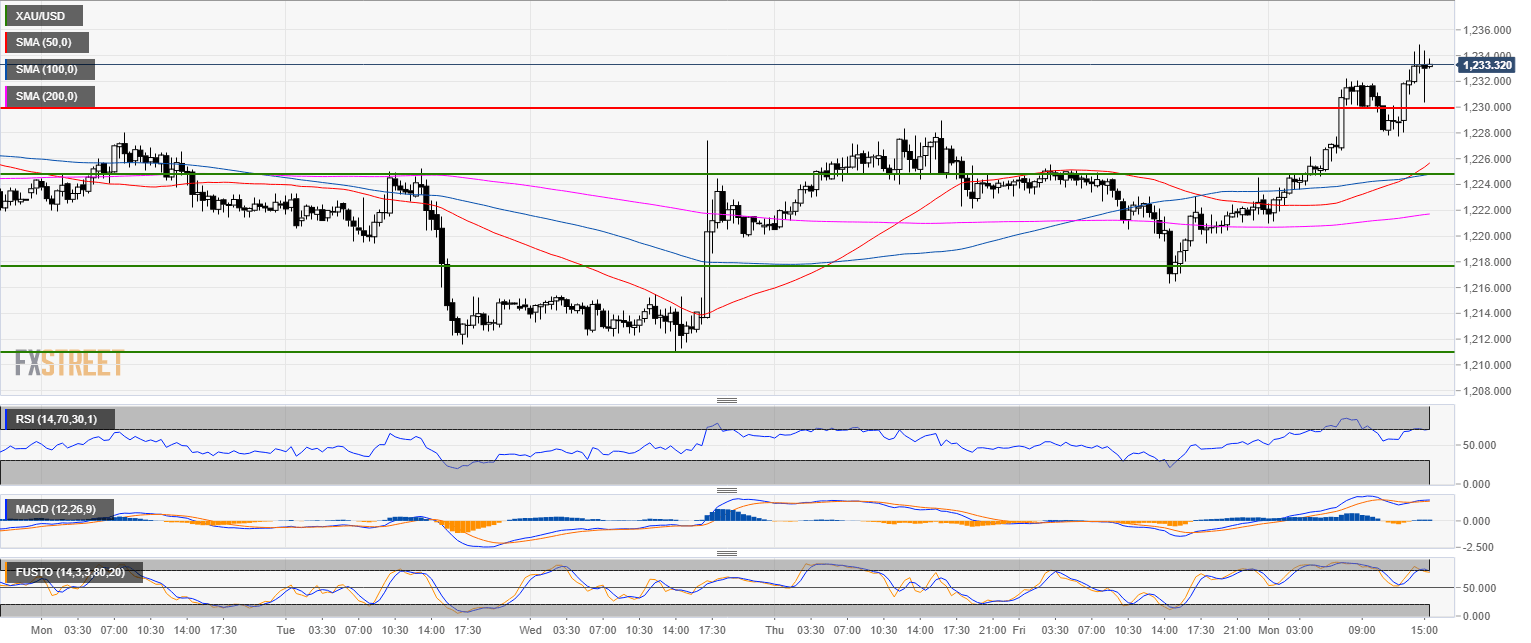
Gold 30-minute chart
- Gold is attempting to break above the key 1,230.00 resistance.
- Bulls need a close above the level on a daily closing basis.
- Failure to move beyound 1235.00 can lead to a drop to the 1,225.00 level
Additional key levels
XAU/USD
Overview:
Today Last Price: 1233.2
Today Daily change: 1.1e+3 pips
Today Daily change %: 0.919%
Today Daily Open: 1221.97
Trends:
Previous Daily SMA20: 1217.21
Previous Daily SMA50: 1220.12
Previous Daily SMA100: 1208.92
Previous Daily SMA200: 1234.55
Levels:
Previous Daily High: 1228.3
Previous Daily Low: 1216.7
Previous Weekly High: 1231.8
Previous Weekly Low: 1211.2
Previous Monthly High: 1237.4
Previous Monthly Low: 1196.4
Previous Daily Fibonacci 38.2%: 1221.13
Previous Daily Fibonacci 61.8%: 1223.87
Previous Daily Pivot Point S1: 1216.35
Previous Daily Pivot Point S2: 1210.72
Previous Daily Pivot Point S3: 1204.75
Previous Daily Pivot Point R1: 1227.95
Previous Daily Pivot Point R2: 1233.92
Previous Daily Pivot Point R3: 1239.55
