- Gold ends the week on its lows as the market is off the 2019 highs.
- The level to beat for bears is the 1,485 support level.
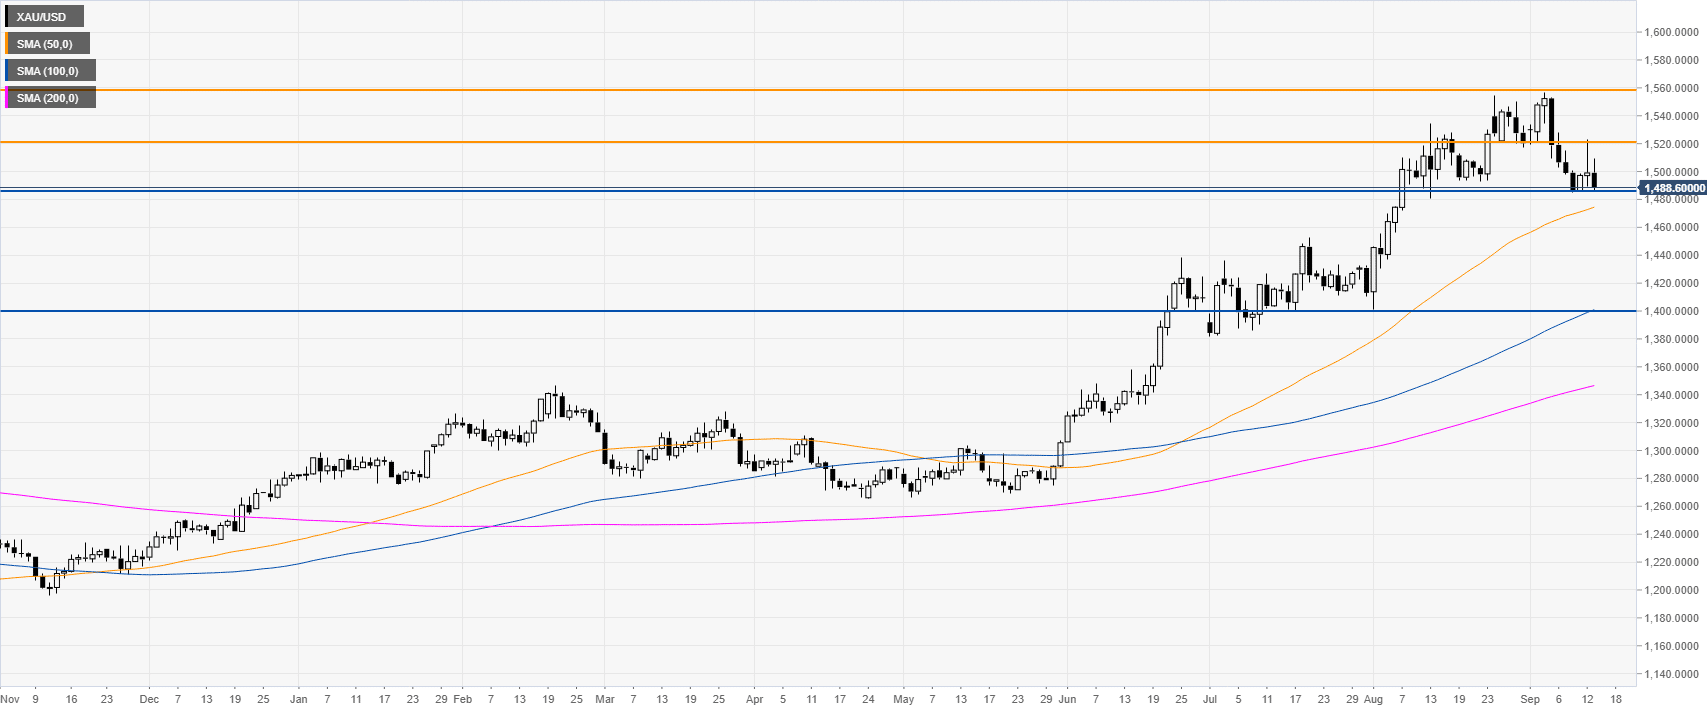
Gold daily chart
The yellow metal is trading in a bull trend above its main daily simple moving averages (SMAs). The market is challenging the 1,485 support above the 50 SMA. A break below the level can open the doors to a selloff towards the 1,400 figure.
The first level of resistance is likely the 1,520.00 resistance followed by 1,560 near the 2019 high.
Additional key levels
