- Bulls were targeting 1315 ahead of the Fed, which has been surpassed now, where it meets the trend-line prior support of the rising channel – 1313 was the 50% Fibo target which has now been conquered in this recent bout of demand post dovish Fed.
- On the next leg up, bulls need to get above 1321 as the 61.8% Fibo.
- However, prior to that, where the eclipse has marked on the 4HR chart, bulls have the ‘bar-brawl’ breakout band to conquer first, a potential bull trap between 1316 resistance, descending trendline resistance and then the 61.8% Fibo.
- Depending on one’s risk appetite, the Ichimoku Cloud’s bullish criteria could be a comfort as a filter by those wishing to engage in a long position immediately/or wait for a break of trendline resistances:
Ichimoku long strategy:
- Price must close above the Cloud.
- Cloud ahead must be bullish (green).
- Conversion Line is greater than the base-line.
- Lagging Span is greater than or crosses above the cloud.
- On a break above the 61.8% Fibo, 1332 guards the 2019 highs as being the 19th Feb high of 1345.19.
- While 4HR Stochastics are neutral, there is still a risk that the Ichimoku Cloud bull strategy had already signalled that breakout overnight with the Laggin Span moving above the cloud on the Fed’s price action.
- Repeated failures at 1316 and/or failures within the eclipse and below the 61.8% Fibo will focus attention back to the downside.
- To the downside, a drop below 1310 will bring 1302 as a key level ahead of 1298, 1290 while 1280 is a keen target. Below there, 1275 remains the line in the sand to the downside, and a break below it will put the attention back to the towards to 1250, a key confluence area made up of Fibos and prior support and resistance.
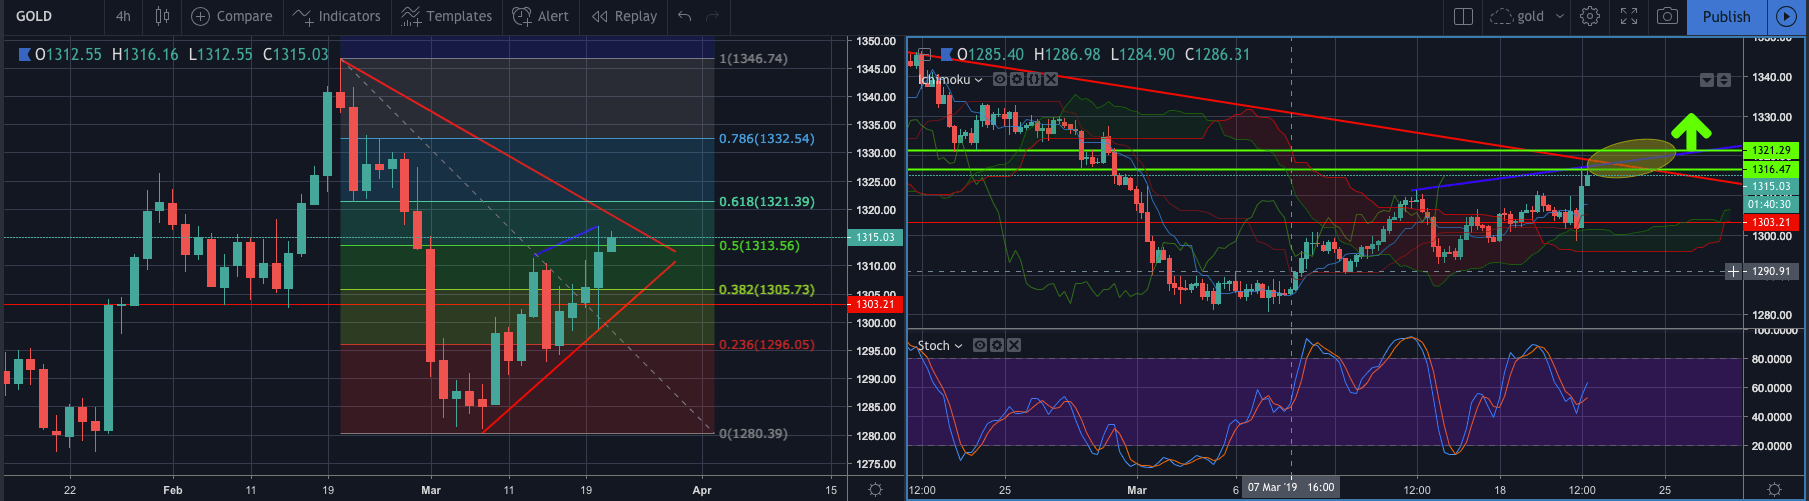
Gold daily and 4hr chart – Trendline, Ichimoku cloud, stochastics and Fibo analysis.
