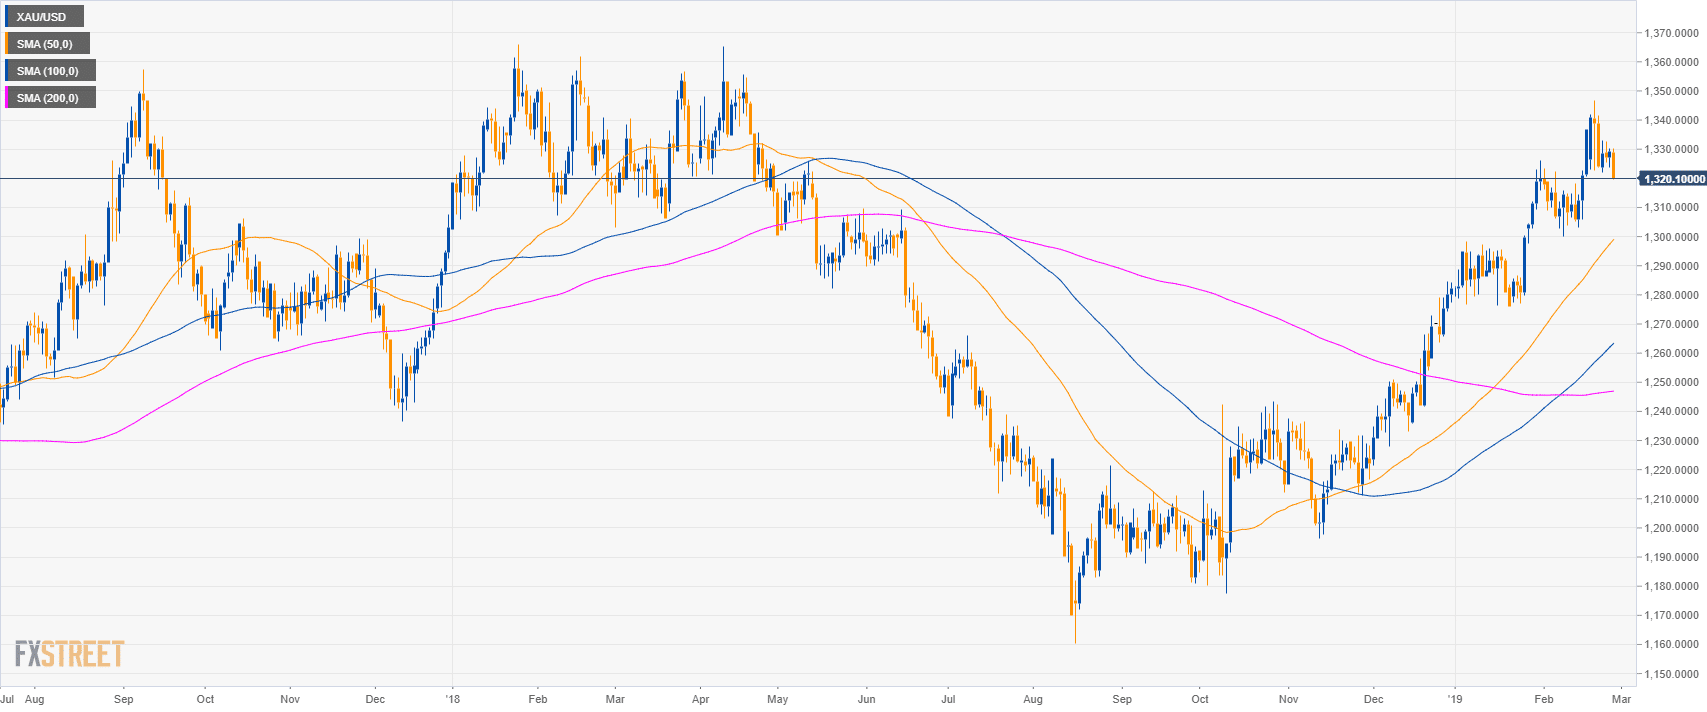
Gold daily chart
- Gold is trading in a bull trend above its main simple moving averages (SMAs).
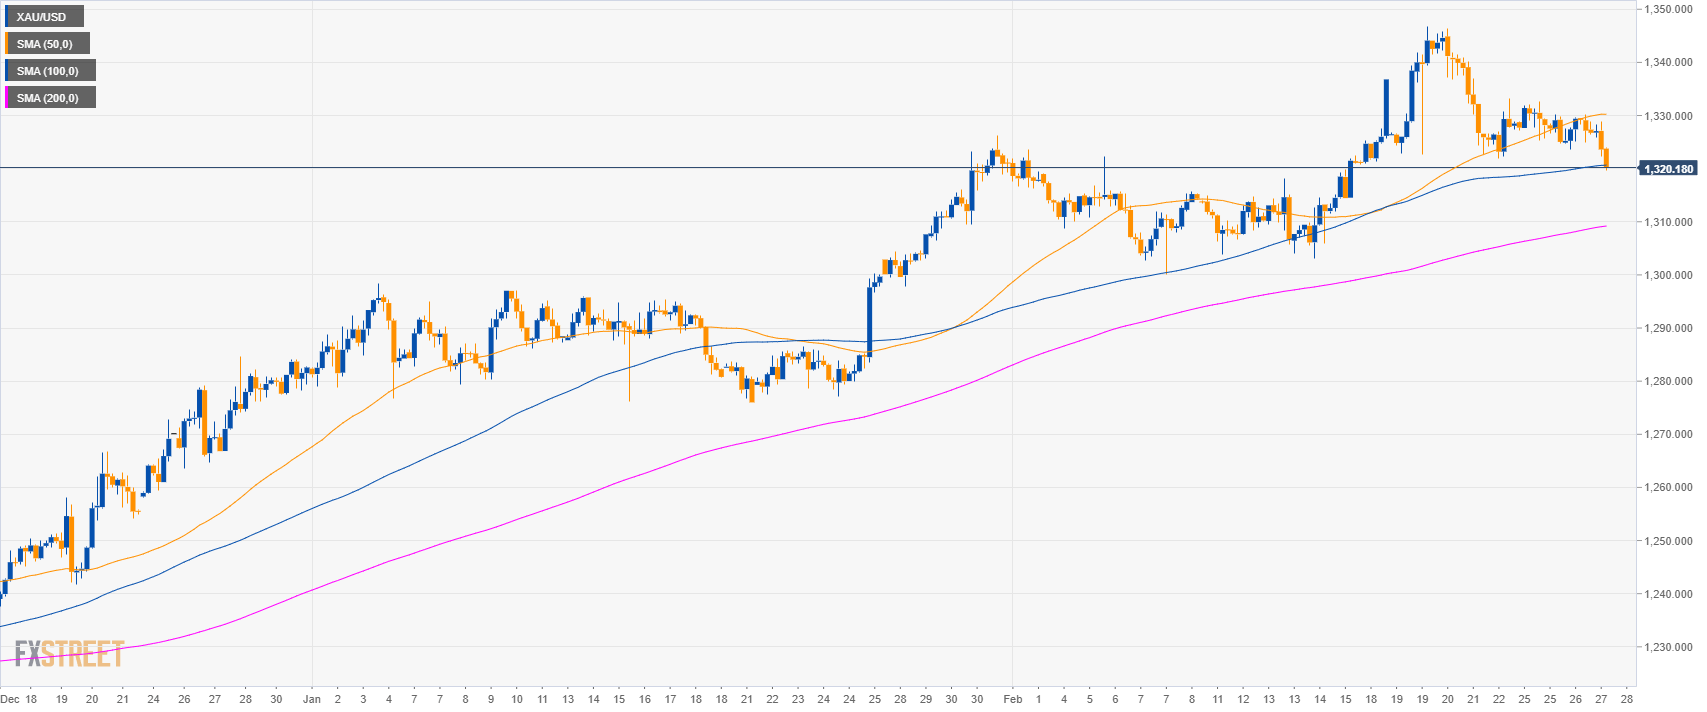
Gold 4-hour chart
- Gold bears are trying to beak below the 100 SMA suggesting a pullback down in the medium-term.
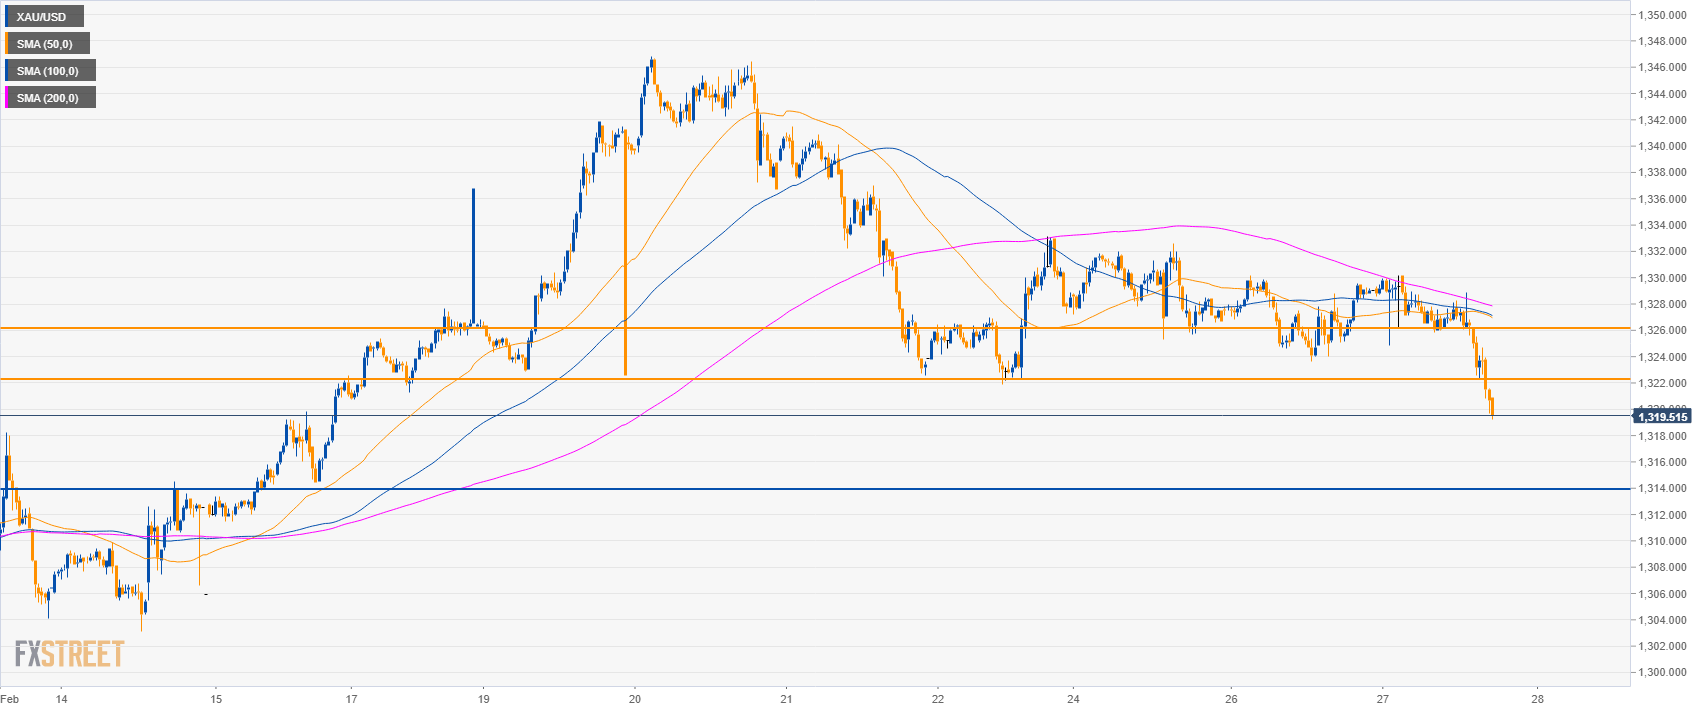
Gold 30-minute chart
- Gold is trading below its main SMAs suggesting bearish momentum.
- As bears broke below 1322.00 key support, the next support to the downside is at the 1,314.00 level. Resistances are at 1,322.00 and 1,326.00 level.
Additional key levels
XAU/USD
Overview:
Today Last Price: 1320.58
Today Daily change: -8.50 points
Today Daily change %: -0.64%
Today Daily Open: 1329.08
Trends:
Daily SMA20: 1319.95
Daily SMA50: 1297.5
Daily SMA100: 1262.33
Daily SMA200: 1235.25
Levels:
Previous Daily High: 1330.2
Previous Daily Low: 1323.65
Previous Weekly High: 1346.85
Previous Weekly Low: 1320.72
Previous Monthly High: 1326.25
Previous Monthly Low: 1275.9
Daily Fibonacci 38.2%: 1327.7
Daily Fibonacci 61.8%: 1326.15
Daily Pivot Point S1: 1325.09
Daily Pivot Point S2: 1321.1
Daily Pivot Point S3: 1318.54
Daily Pivot Point R1: 1331.64
Daily Pivot Point R2: 1334.2
Daily Pivot Point R3: 1338.19
