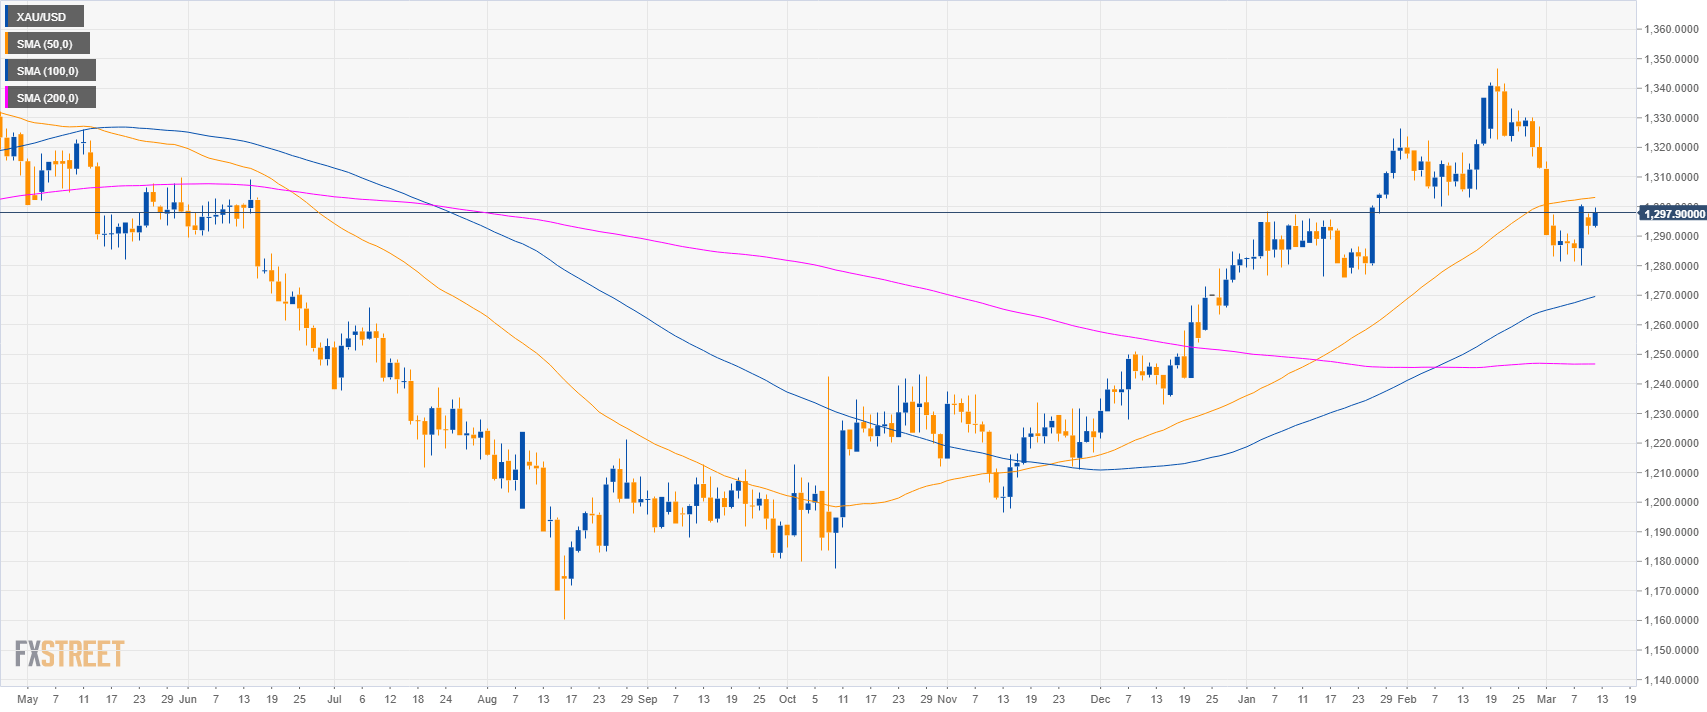
Gold daily chart
- Gold is trading in a bull trend above the 100 and 100-day simple moving averages (SMAs).
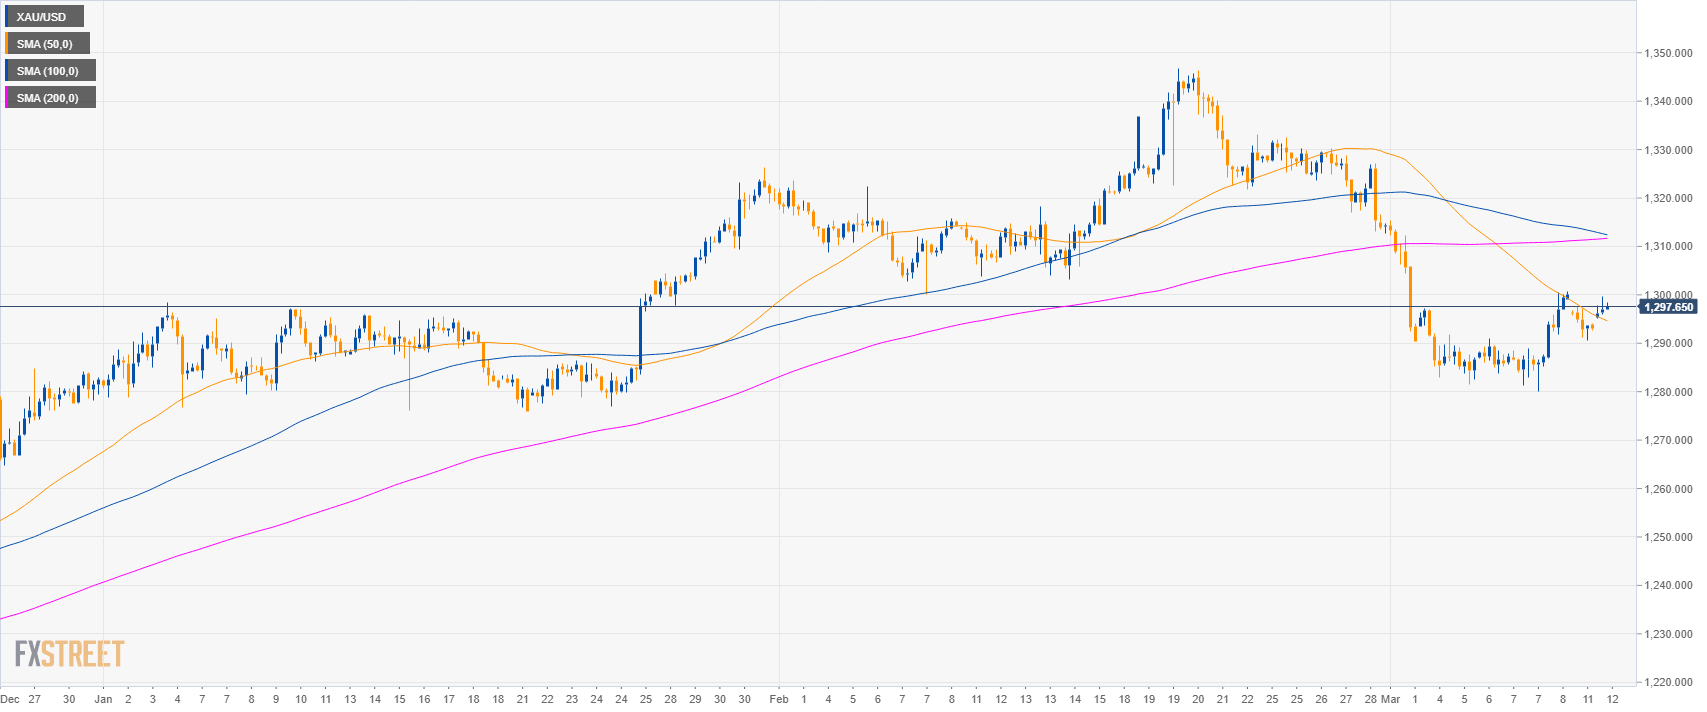
Gold 4-hour chart
- Gold is trading between the 50 and 200 SMAs suggesting a consolidation phase in the medium-term.
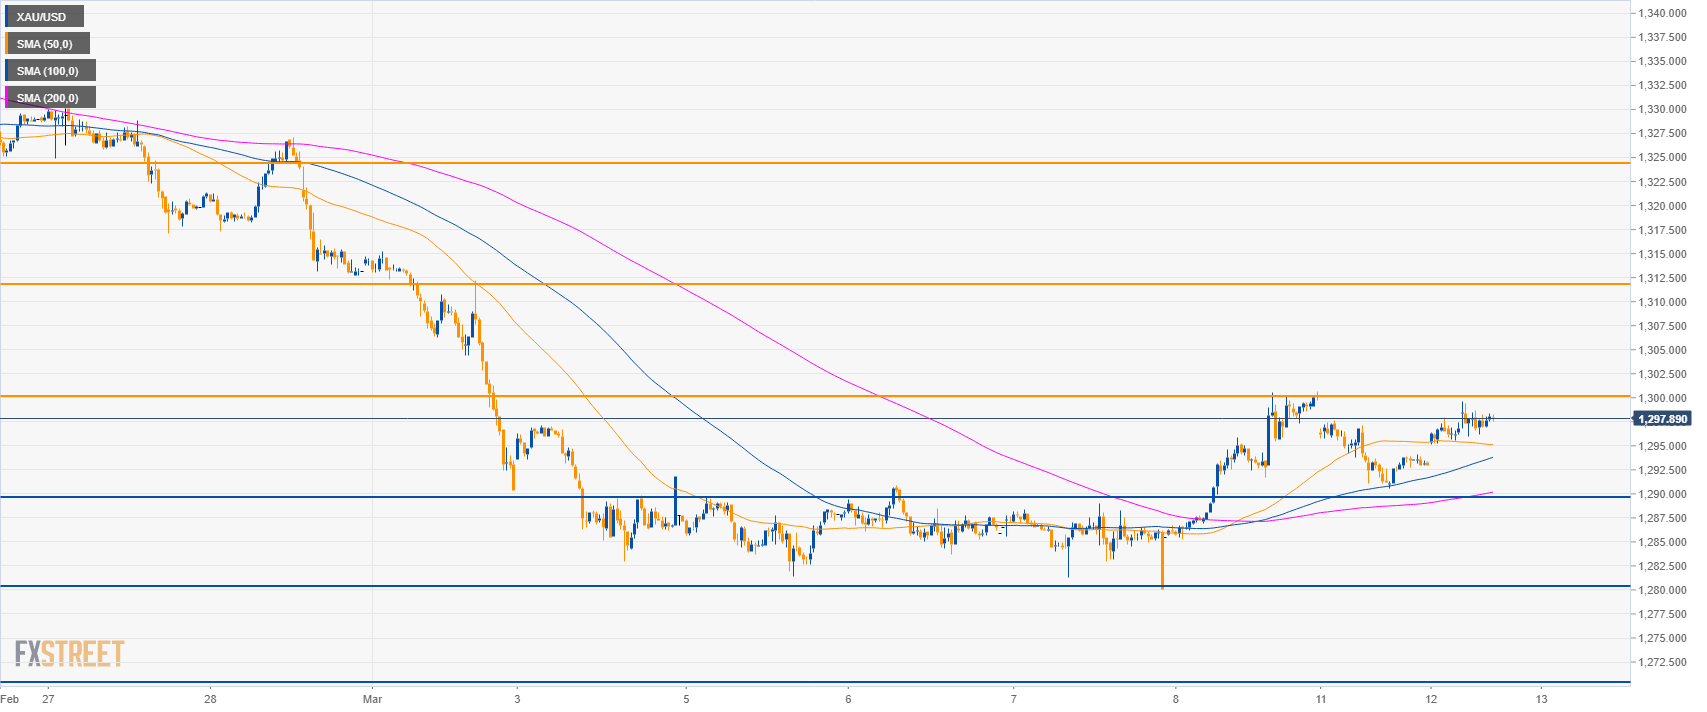
Gold 30-minute chart
- Gold is trading above its main SMAs suggesting a bullish bias in the short-term.
- A break above $1,300.00 a troy ounce can lead to 1,312.00 and 1,325.00 resistances.
- To the donwside, supports are seen near 1,290.00; 1,280.00 and 1,270.00 level.
Additional key levels
.
XAU/USD
Overview:
Today Last Price: 1298
Today Daily change: 4.52 points
Today Daily change %: 0.35%
Today Daily Open: 1293.48
Trends:
Daily SMA20: 1312.08
Daily SMA50: 1302.78
Daily SMA100: 1268.38
Daily SMA200: 1237.75
Levels:
Previous Daily High: 1297.65
Previous Daily Low: 1290.6
Previous Weekly High: 1300.7
Previous Weekly Low: 1280.1
Previous Monthly High: 1346.85
Previous Monthly Low: 1300.1
Daily Fibonacci 38.2%: 1293.29
Daily Fibonacci 61.8%: 1294.96
Daily Pivot Point S1: 1290.17
Daily Pivot Point S2: 1286.86
Daily Pivot Point S3: 1283.12
Daily Pivot Point R1: 1297.22
Daily Pivot Point R2: 1300.96
Daily Pivot Point R3: 1304.27
