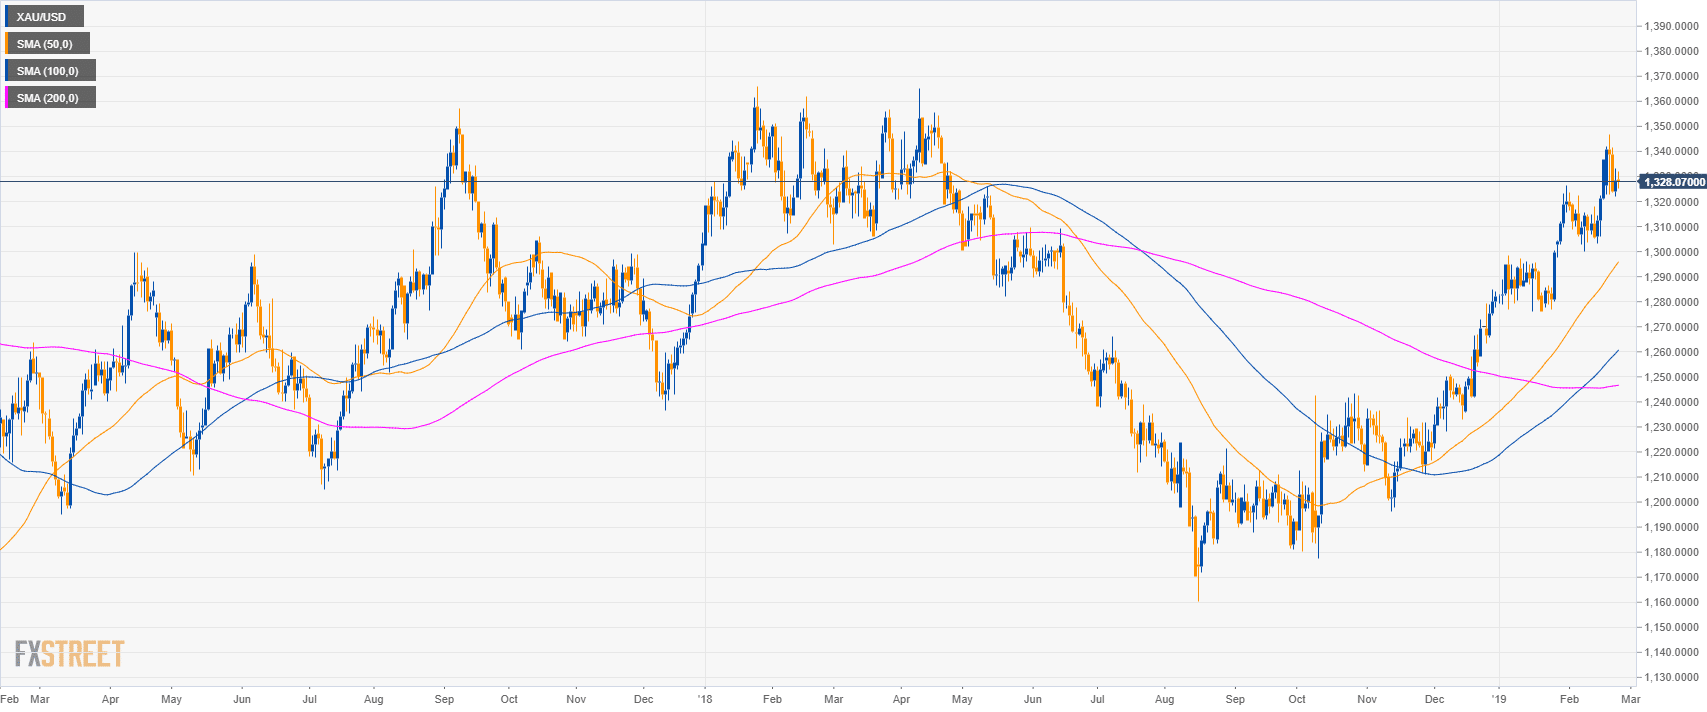
Gold daily chart
- Gold is trading in a bull leg above the main simple moving averages (SMAs).
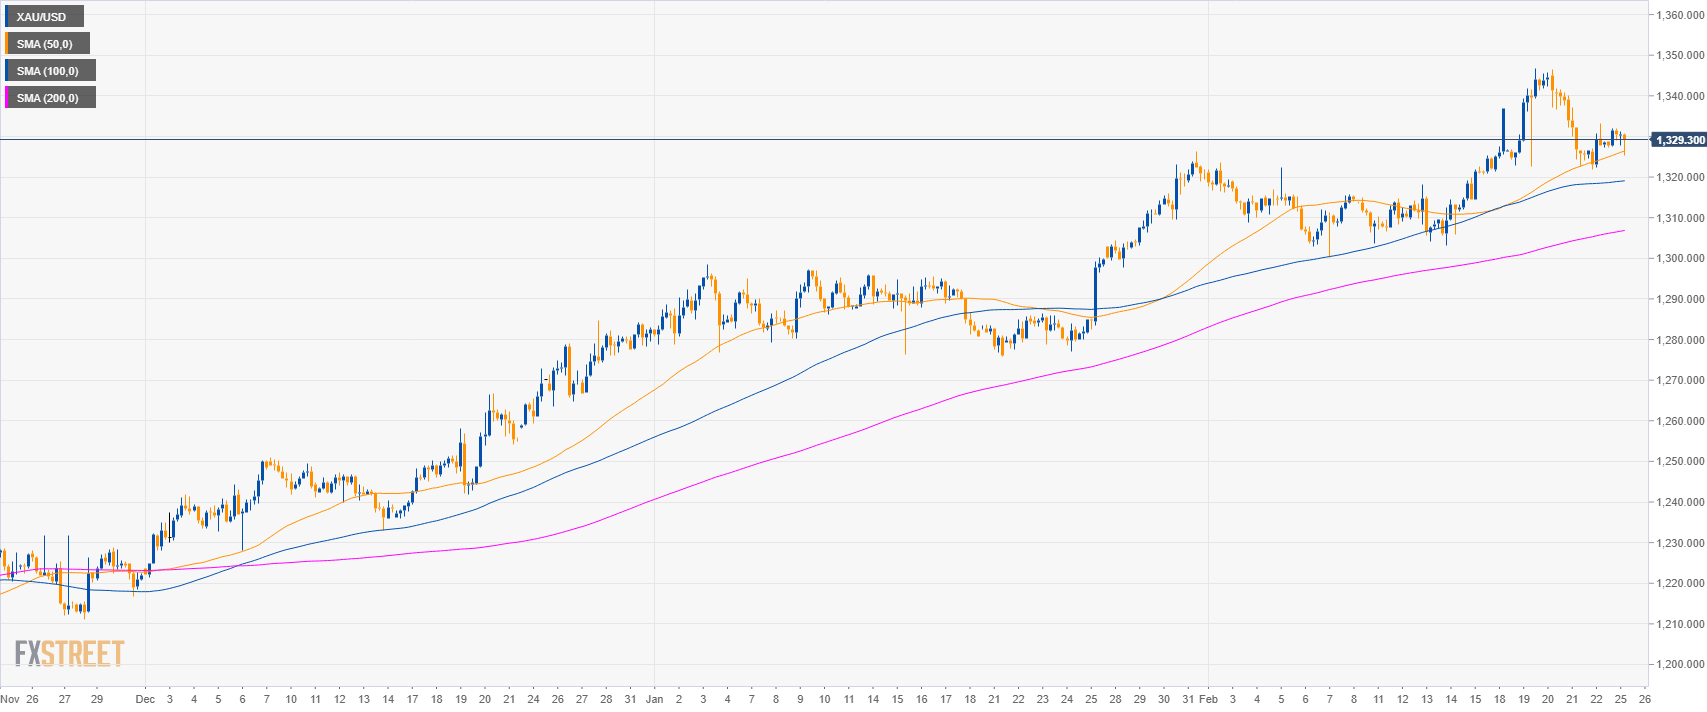
Gold 4-hour chart
- Gold is trading above its main SMAs suggesting a bullish bias in the medium-term.
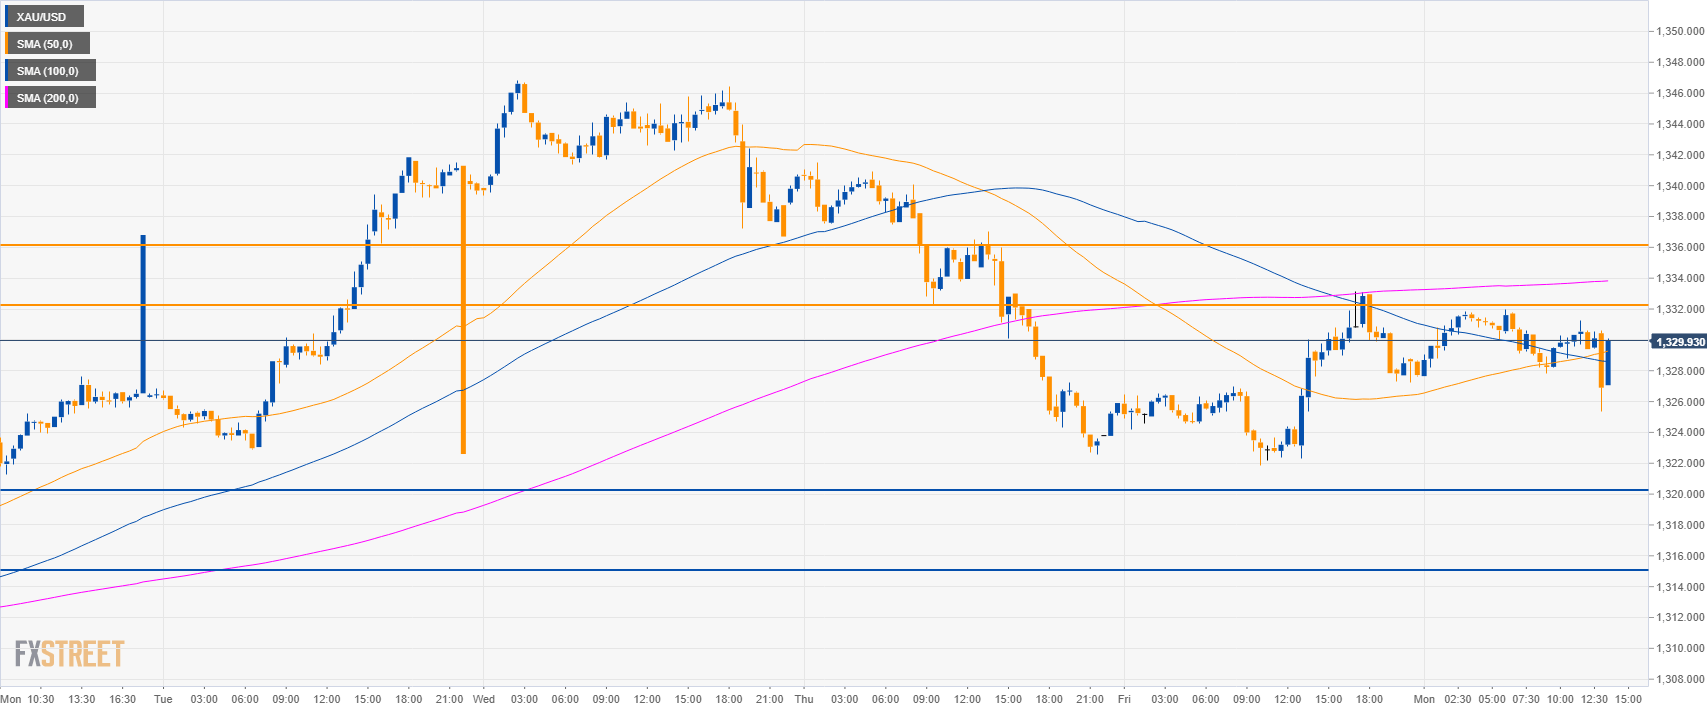
Gold 30-minute chart
- Gold is trading between the 100 and 200 SMAs suggesting sideways action in the short-term.
- Key resistance to break for bulls is 1,332.00 level. The main target to the upside is at 1,336.00 level.
- Key support is at 1,320.00 and 1,315 level.
Additional key levels
