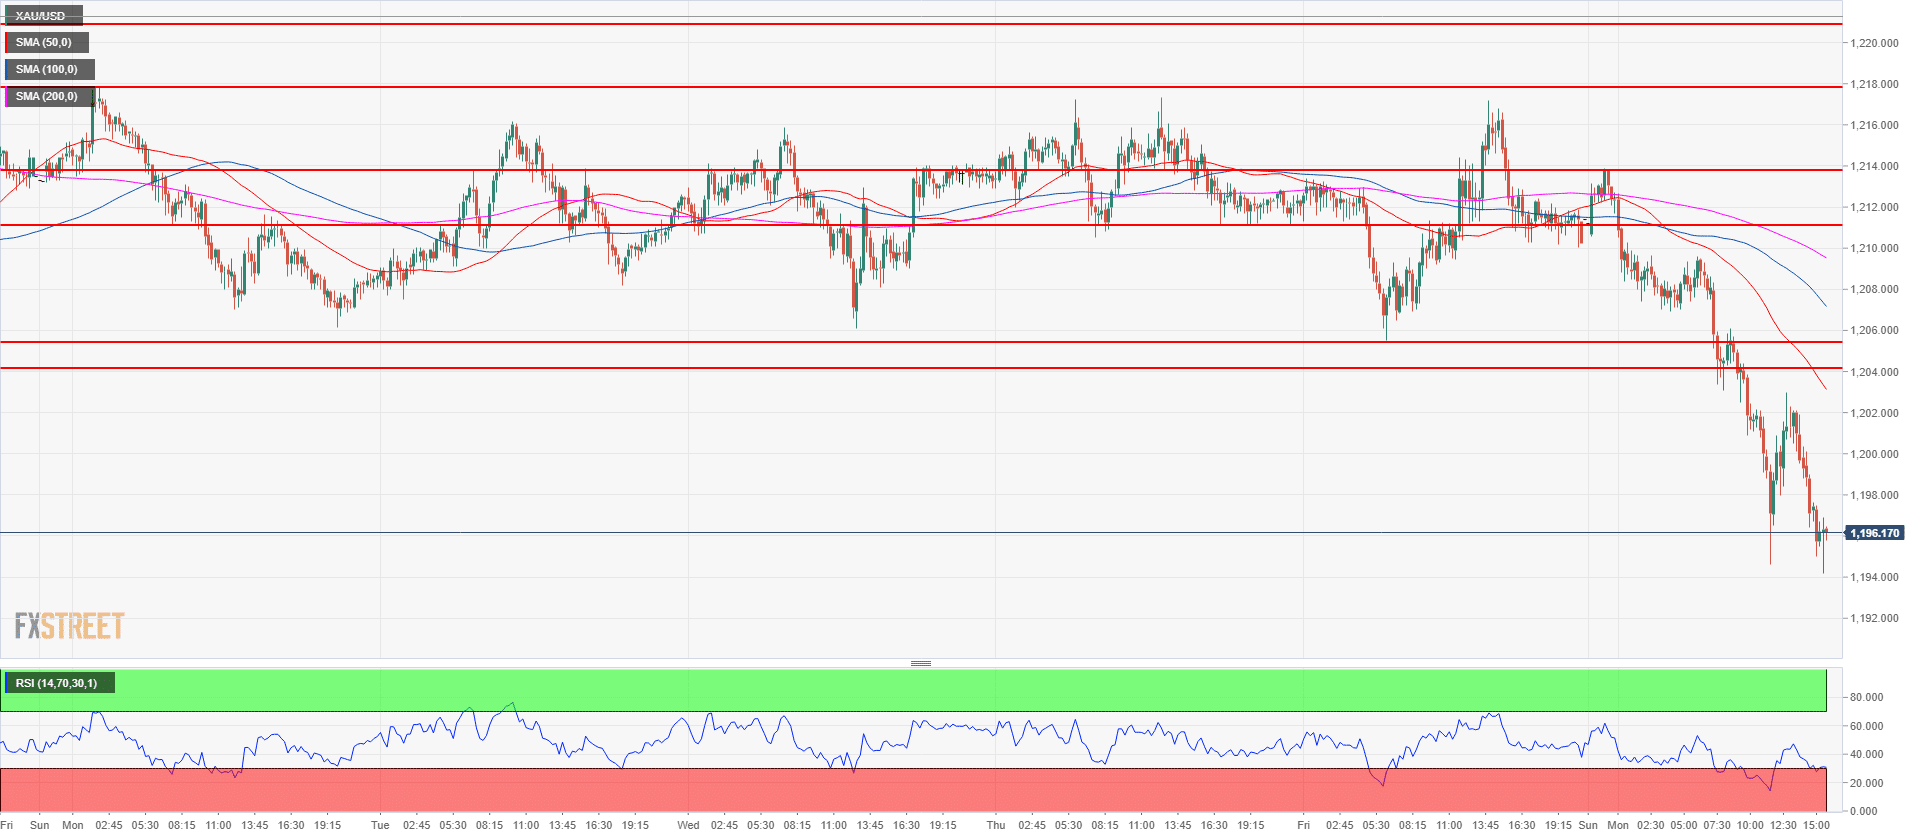
- Gold broke below the 1,204.10 level, which was the former 2018 low which supported the price in the first weeks of August. Currently gold found some near-term support just above 1,194.30 March 10, 2017 low.
- As the bear trend on gold remains intact, bears next objective become 1,180.62, January 27, 2017 low and 1,145.20 March, 1 2017 low.
- Pullbacks to the upside could lead to 1,204.10 resistance and 1,211.17 July 19 low.
Gold daily chart
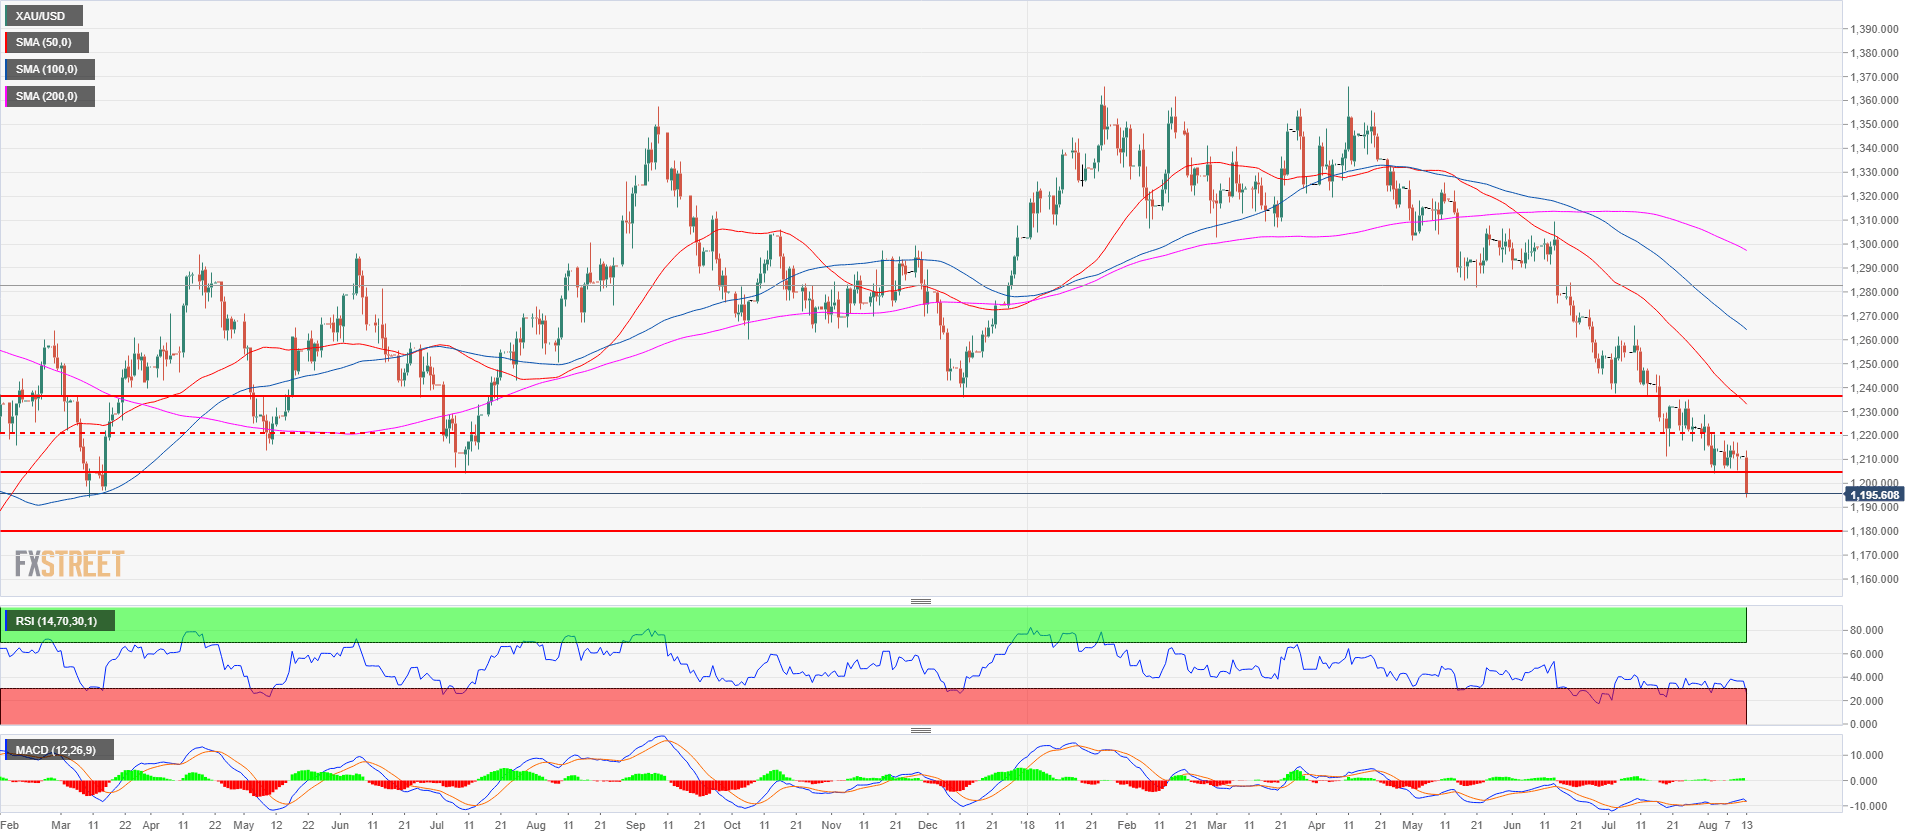
Spot rate: 1,195.00
Relative change: -1.33%
High: 1,213.87
Low: 1,194.20
Trend: Bearish
Resistance 1: 1,205.50-1,204.10 area, August 10 low and 2018 low
Resistance 2: 1,211.17 July 19 low
Resistance 3: 1,213.70 July 31 low
Resistance 4: 1,217.89-1,220.90 area, August 6 high and July 18 low
Resistance 5: 1,223.00 consolidation area
Resistance 6: 1,225.90 July 17 low
Resistance 7: 1,232.00 consolidation area
Resistance 8: 1,236.28 July 13 low, key level
Resistance 9: 1,241.50 intraday swing low
Resistance 10: 1,245.65 June 28 low
Support 1: 1,194.30 March 10, 2017 low
Support 2: 1,180.62 January 27, 2017 low
Support 3: 1,145.20 March, 1 2017 low
