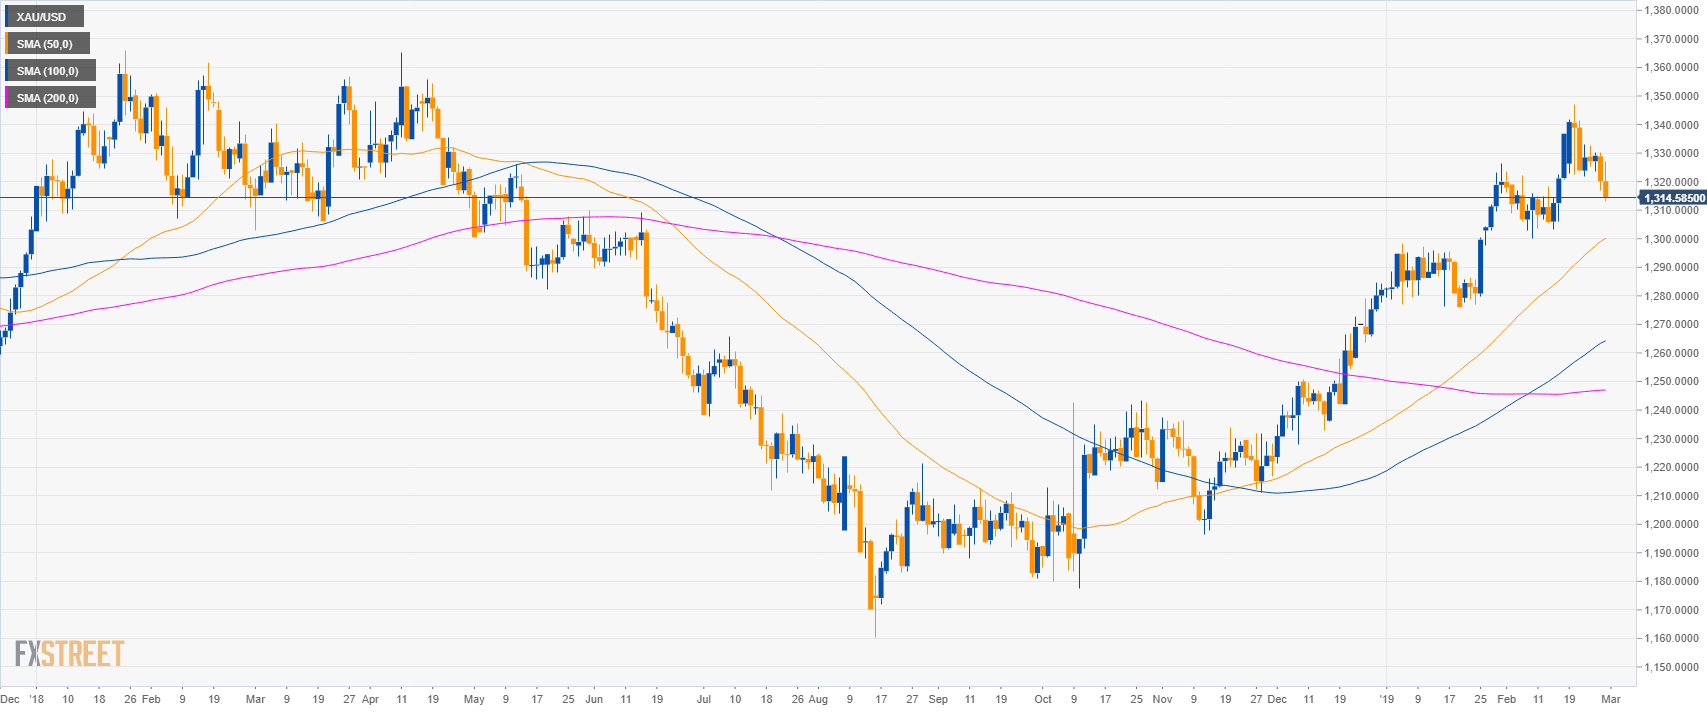
Gold daily chart
- Gold is trading in a bull trend above its main simple moving averages (SMAs).
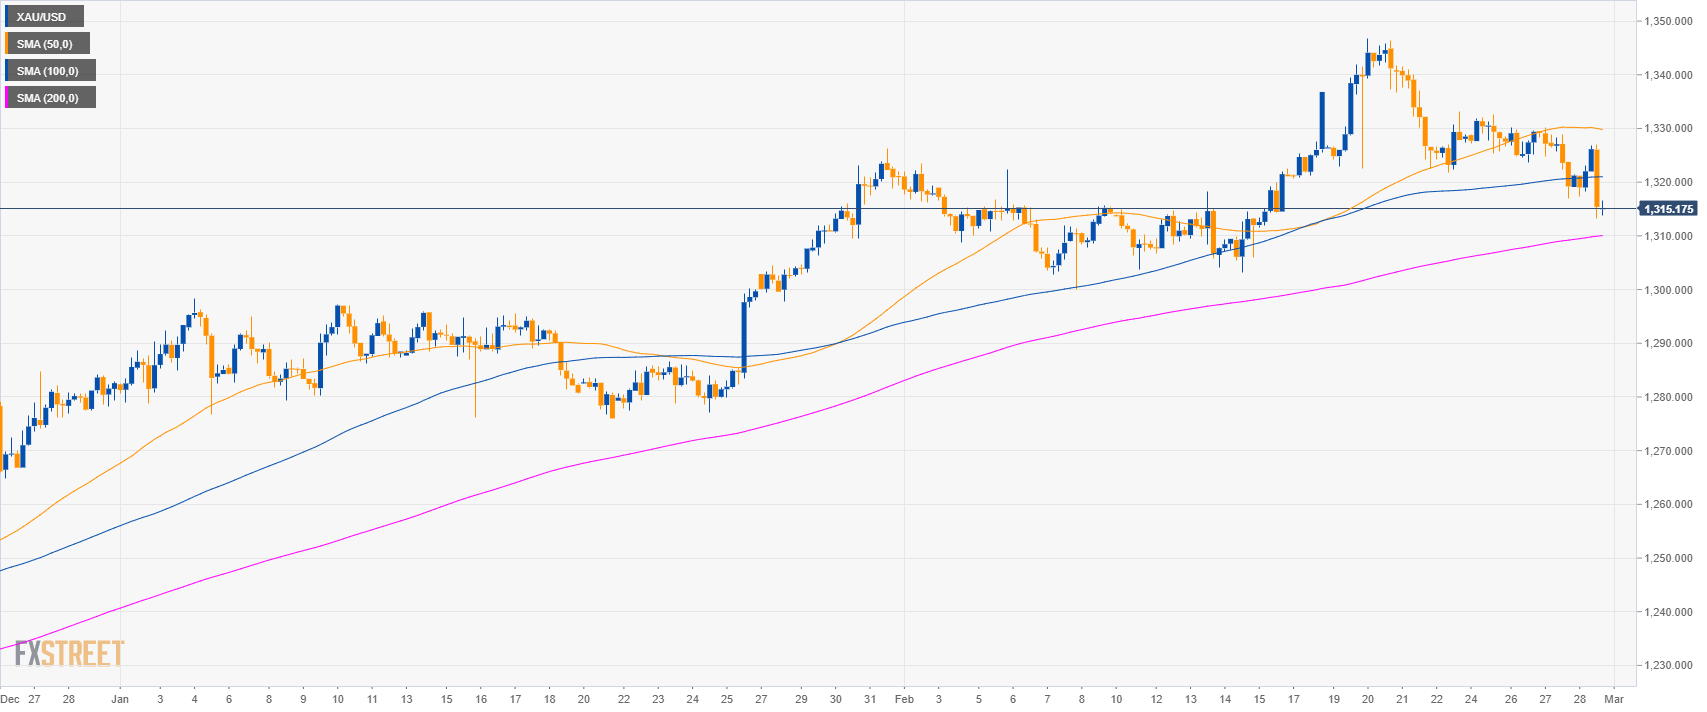
Gold 4-hour chart
- Gold is trading between the 100 and 200 SMAs suggesting a consolidation phase in the medium-term.
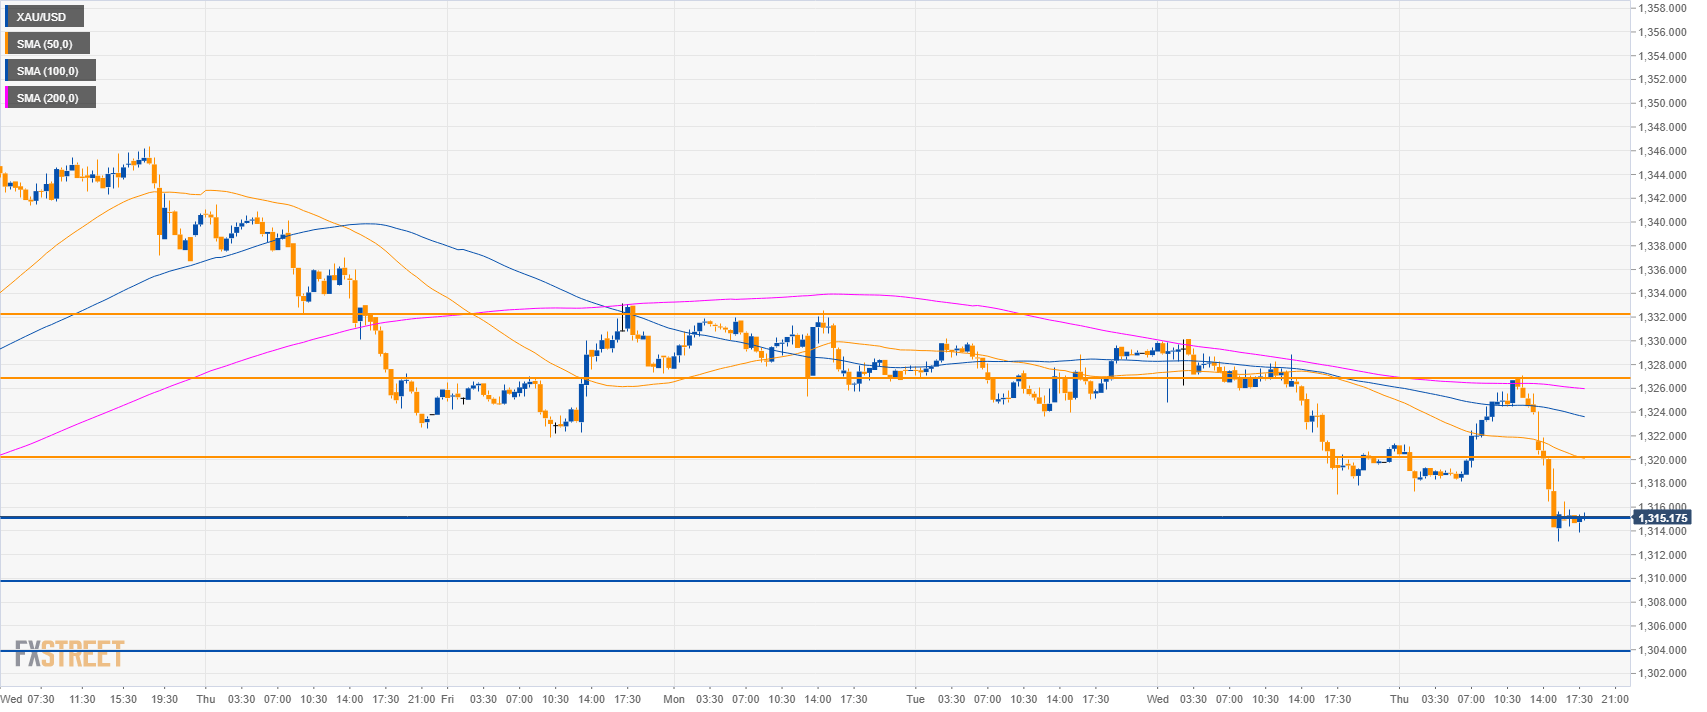
Gold 30-minute chart
- Gold reached the 1,314.00 bear target discussed on Wednesday as the market is trading below its main SMAs.
- The Yellow Metal is quite weak in the short-term and could slip further to 1,310.00 and $1,304.00/oz support.
- Looking up, resistances are at 1,320.00, 1,325.00 figure and 1,332.00 level.
Additional key levels
XAU/USD
Overview:
Today Last Price: 1315.14
Today Daily change: -4.96 points
Today Daily change %: -0.38%
Today Daily Open: 1320.1
Trends:
Daily SMA20: 1320.01
Daily SMA50: 1299.06
Daily SMA100: 1263.27
Daily SMA200: 1235.57
Levels:
Previous Daily High: 1330.15
Previous Daily Low: 1317.05
Previous Weekly High: 1346.85
Previous Weekly Low: 1320.72
Previous Monthly High: 1326.25
Previous Monthly Low: 1275.9
Daily Fibonacci 38.2%: 1322.05
Daily Fibonacci 61.8%: 1325.15
Daily Pivot Point S1: 1314.72
Daily Pivot Point S2: 1309.33
Daily Pivot Point S3: 1301.62
Daily Pivot Point R1: 1327.82
Daily Pivot Point R2: 1335.53
Daily Pivot Point R3: 1340.92
