- Gold has been trading sideways for nine consecutive weeks.
- Gold is now attempting to break below the 1,182.90-$1,210.00 a troy range.
- A failed breakout below 1,182.90 (August 24 low) would invalidate the current bearish bias and keep Gold into its current range. Alternatively, a bear breakout below the level can send gold to 1,172.82 (current 2018 low)
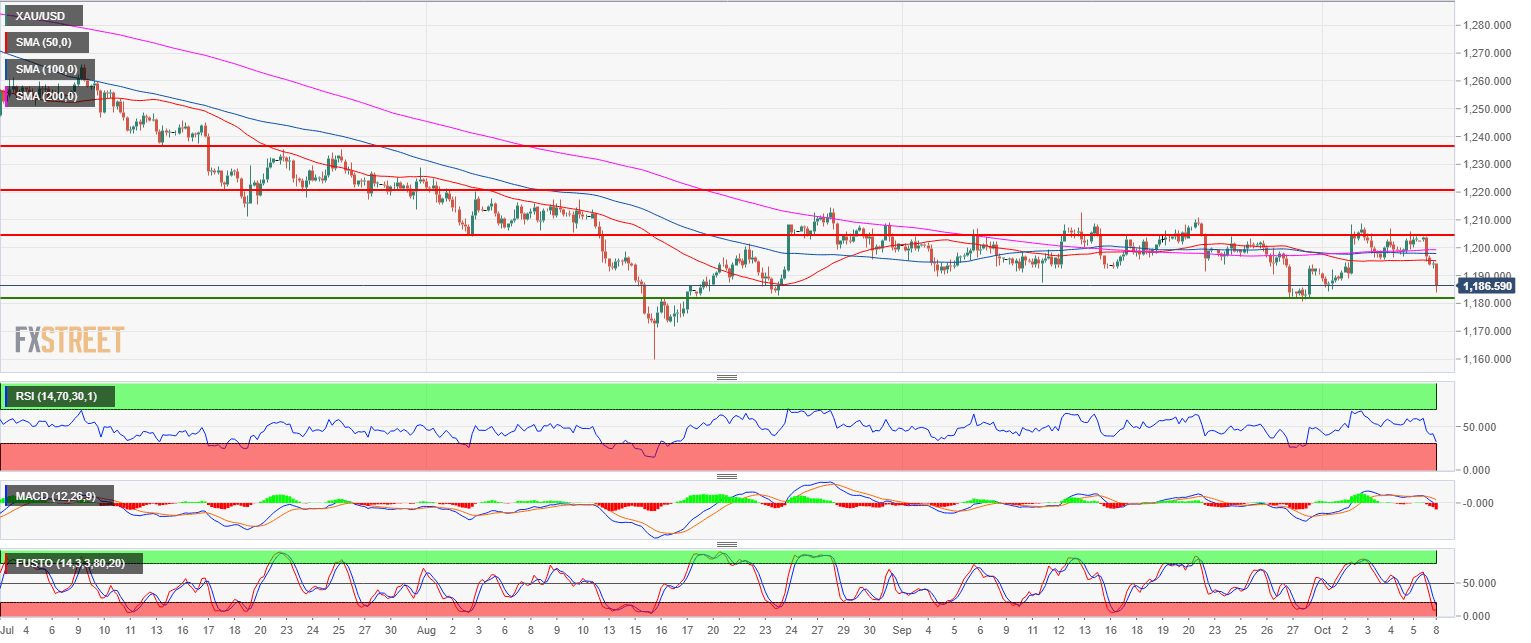
Spot rate: 1,186.20
Relative change: 1.33%
High: 1,204.08
Low: 1,183.80
Main trend: Bearish
Short-term trend: Bullish
Resistance 1: 1,189.49 September 4 low
Resistance 2: 1,194.30 March 10, 2017 low
Resistance 3: 1,204.10, August 3 swing low (key level)
Resistance 4: 1,211.17 July 19 low
Resistance 5: 1,214.30 August 28 high
Resistance 6: 1,217.89-1,220.90 zone, August 6 high and July 18 low
Resistance 7: 1,225.90 July 17 low
Resistance 8: 1,237.60 July 3 swing low
Support 1: 1,182.90 August 24 low
Support 2: 1,172.82 current 2018 low
Support 3: 1,145.20 March, 1 2017 low
