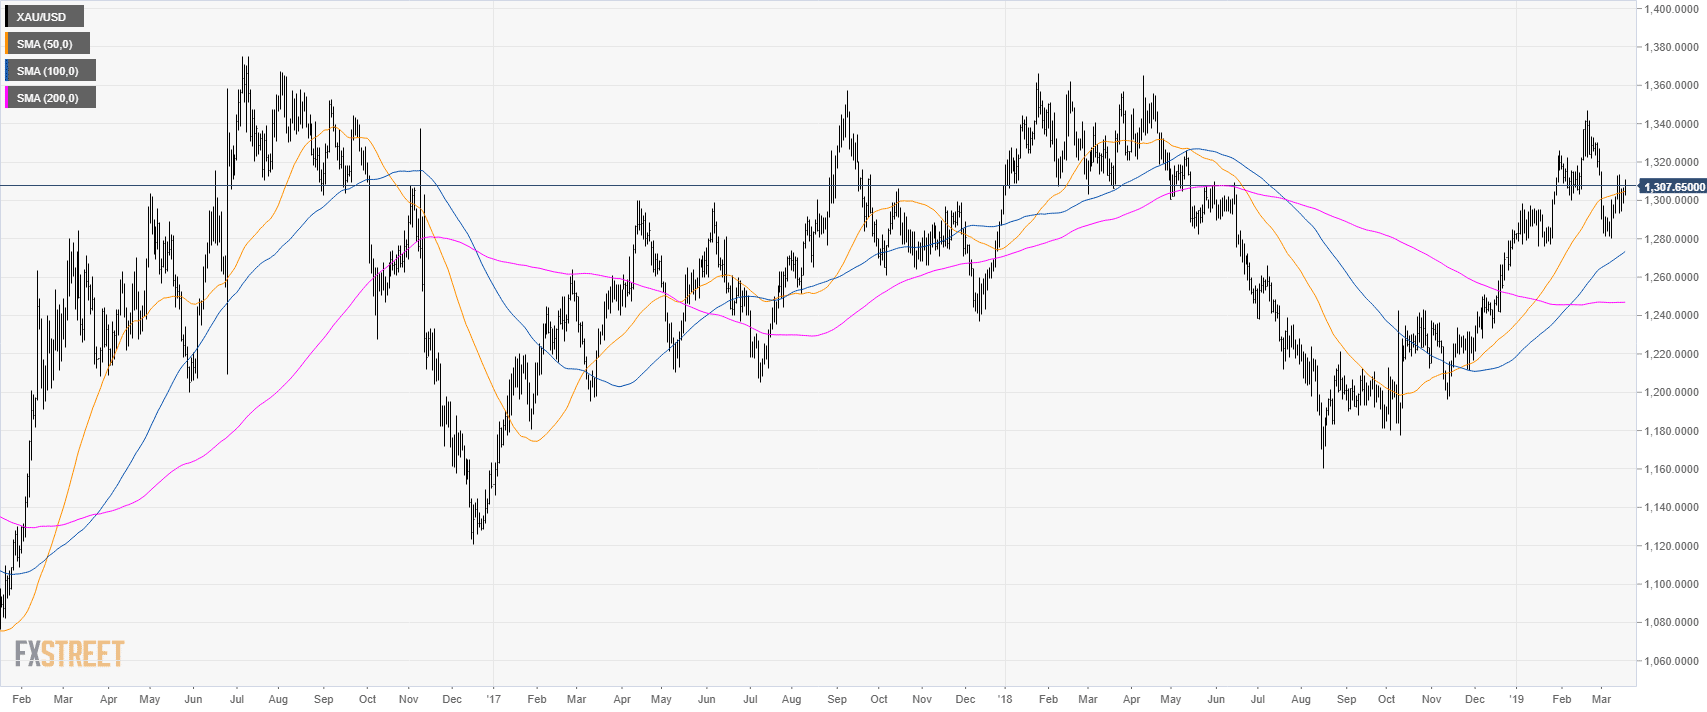
Gold daily chart
- Gold is trading in a bull trend above its main simple moving averages (SMAs).
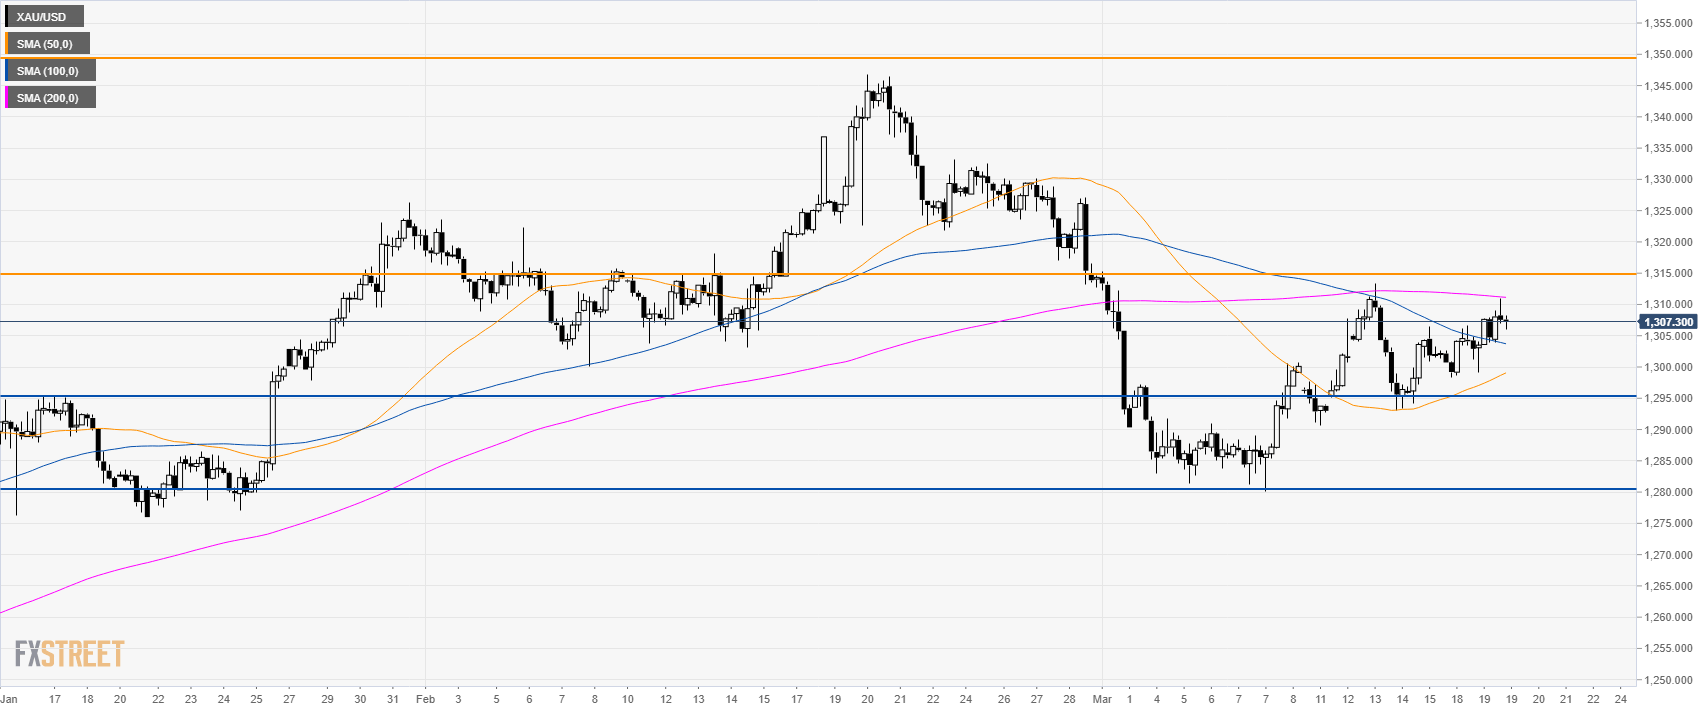
Gold 4-hour chart
- Gold is trading between the 100 and 200 SMAs suggesting a consolidation phase in the medium-term.
- Key resistance for bulls to break is 1,315.00. The next main resistance is at $1,350.00/oz.
- Supports are at 1,295.00 and 1,280.00 level.
Additional key levels
USD/CAD
Overview:
Today Last Price: 1.3308
Today Daily change: -26 pips
Today Daily change %: -0.19%
Today Daily Open: 1.3334
Trends:
Daily SMA20: 1.3287
Daily SMA50: 1.3263
Daily SMA100: 1.3304
Daily SMA200: 1.3189
Levels:
Previous Daily High: 1.3368
Previous Daily Low: 1.3302
Previous Weekly High: 1.344
Previous Weekly Low: 1.3287
Previous Monthly High: 1.3341
Previous Monthly Low: 1.3069
Daily Fibonacci 38.2%: 1.3342
Daily Fibonacci 61.8%: 1.3327
Daily Pivot Point S1: 1.3302
Daily Pivot Point S2: 1.3269
Daily Pivot Point S3: 1.3236
Daily Pivot Point R1: 1.3367
Daily Pivot Point R2: 1.34
Daily Pivot Point R3: 1.3433
