- Gold bear trend has been on hold for the last five weeks.
- Gold bulls broke above the bull flag last week and are now busy trying to break above 1,204.10 (August 3 swing low, key level). A break above the level can open the gates towards 1,225.90 (July 17 low). The RSI, MACD and Stochastics indicators are pointing to more gains.
- A bear breakout below 1,189.49 (September 4 low) would invalidate the bullish bias.
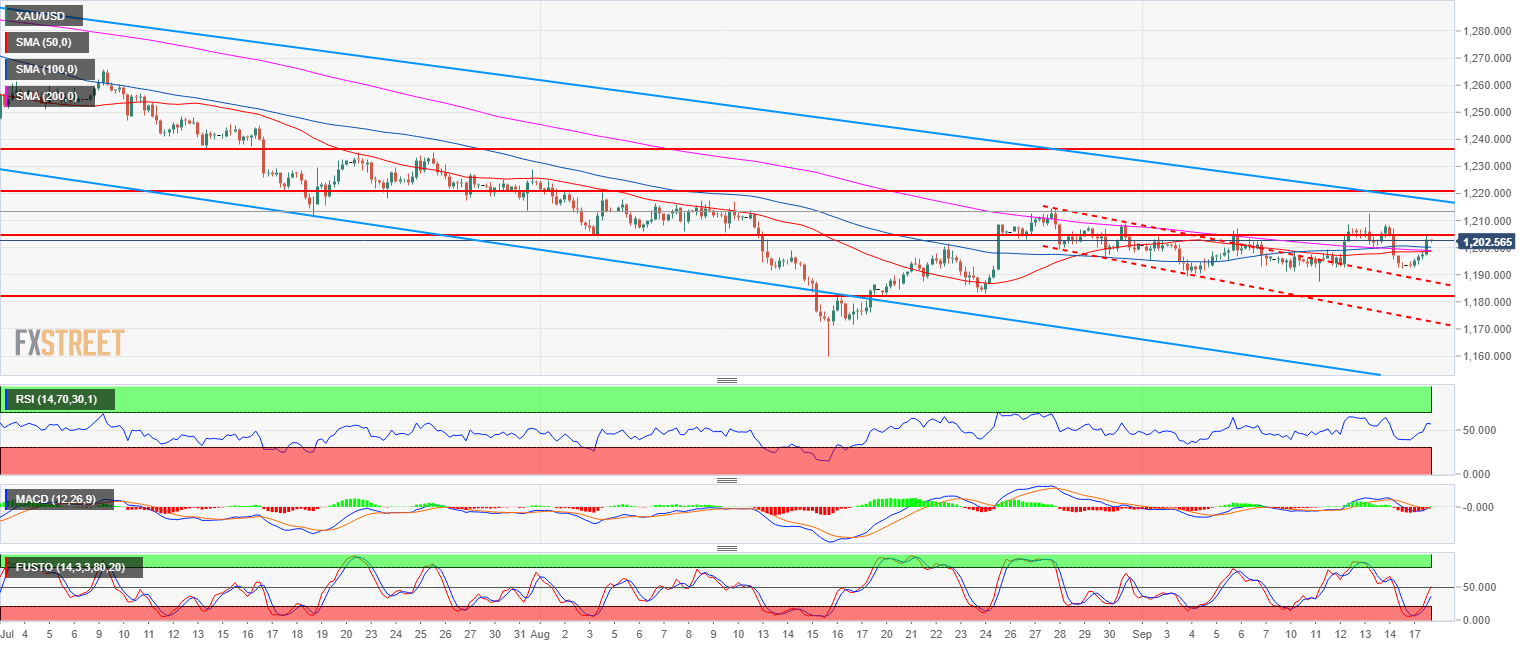
Spot rate: 1,202.75
Relative change: 0.76%
High: 1,204.90
Low: 1,192.50
Trend: Bearish
Short-term trend: Bullish above 1,182.90
Resistance 1: 1,204.10, August 3 swing low (key level)
Resistance 2: 1,211.17 July 19 low
Resistance 3: 1,214.30 August 28 high
Resistance 4: 1,217.89-1,220.90 zone, August 6 high and July 18 low
Resistance 5: 1,225.90 July 17 low
Support 1: 1,194.30 March 10, 2017 low
Support 2: 1,189.49 September 4 low
Support 3: 1,172.82 current 2018 low
Support 4: 1,145.20 March, 1 2017 low
