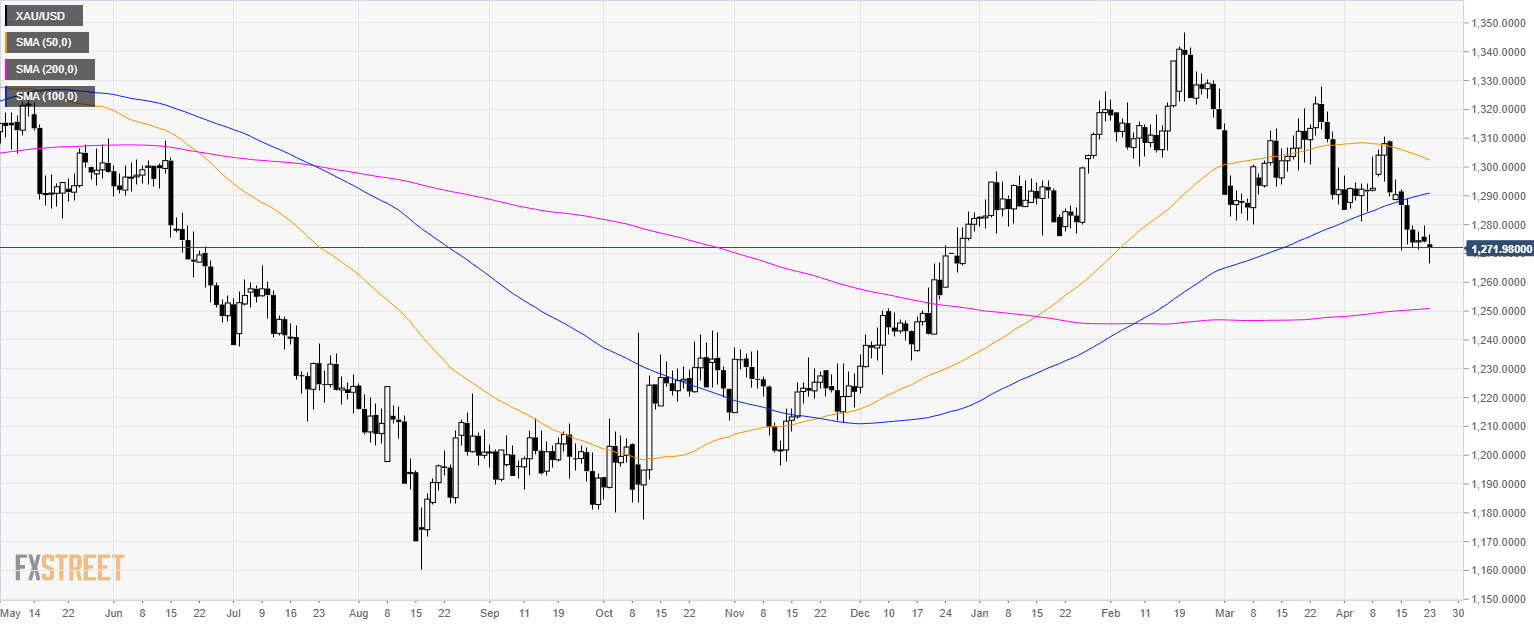
Gold daily chart
- Gold is trading below $1,280.00 per troy ounce and the 100 and 200 simple moving averages (SMAs) suggesting bearish pressure.
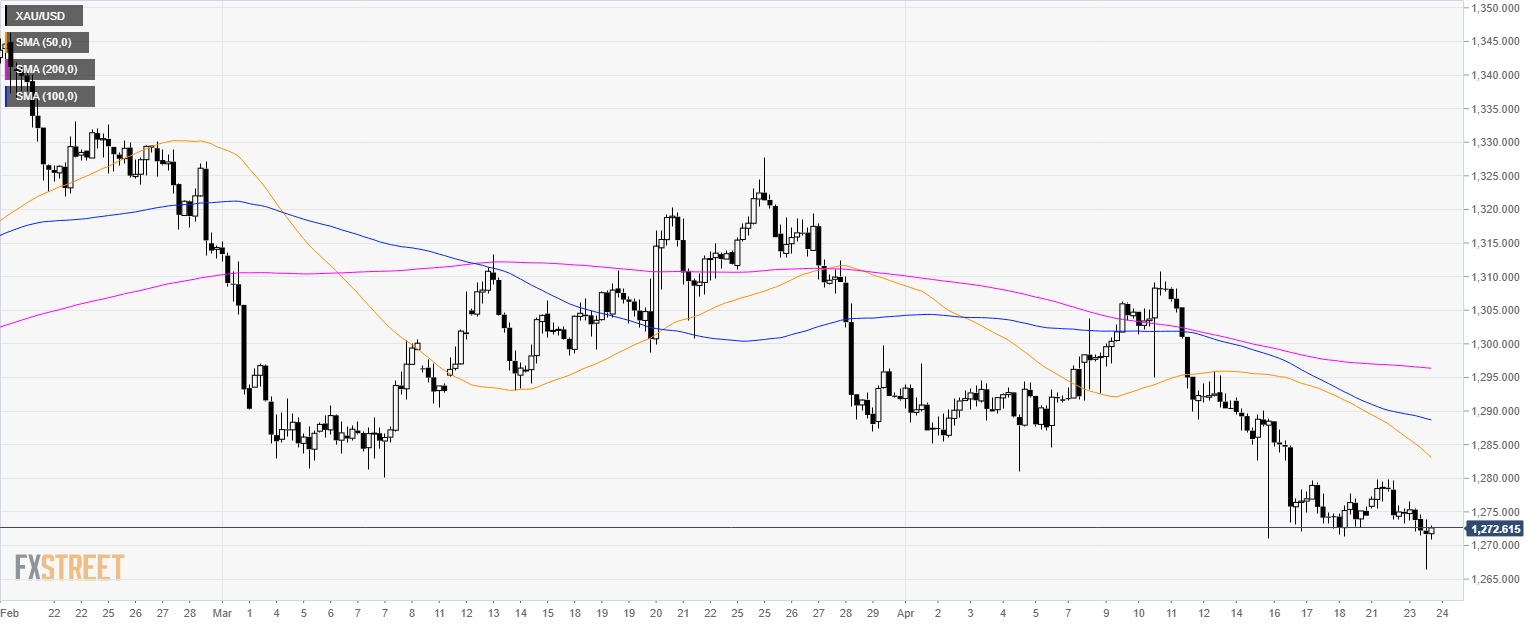
Gold 4-hour chart
- Gold is trading below its main SMAs suggesting a bearish bias in the medium-term.
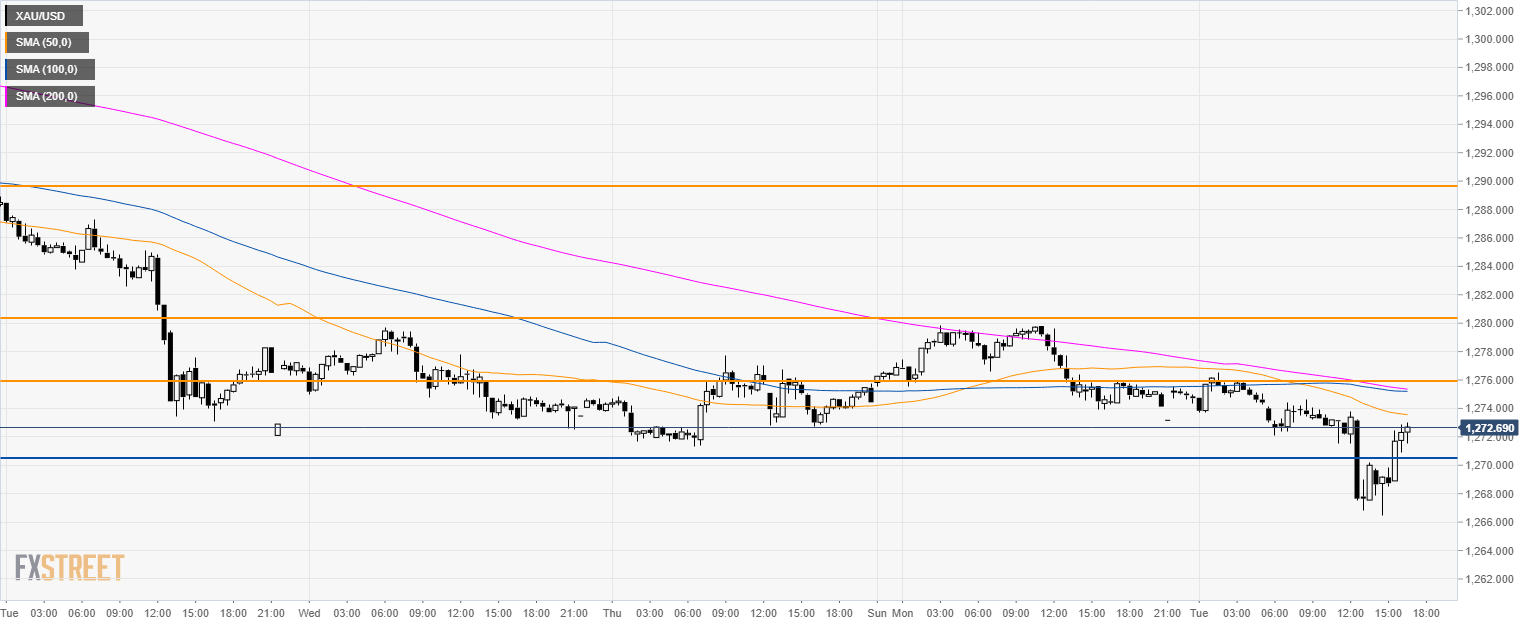
Gold 30-minute chart
- Gold is trading below its main SMAs suggesting a bearish momentum in the short-term.
- Bulls have reversed a good chunk of the daily losses however, they face resistance at 1,276.00 and 1,280.00 levels. Further up, lies 1,290.00 resistance.
- A bear break below 1,270.00 can potentially lead to 1,260.00 level and 1,247.00 support.
Additional key levels
