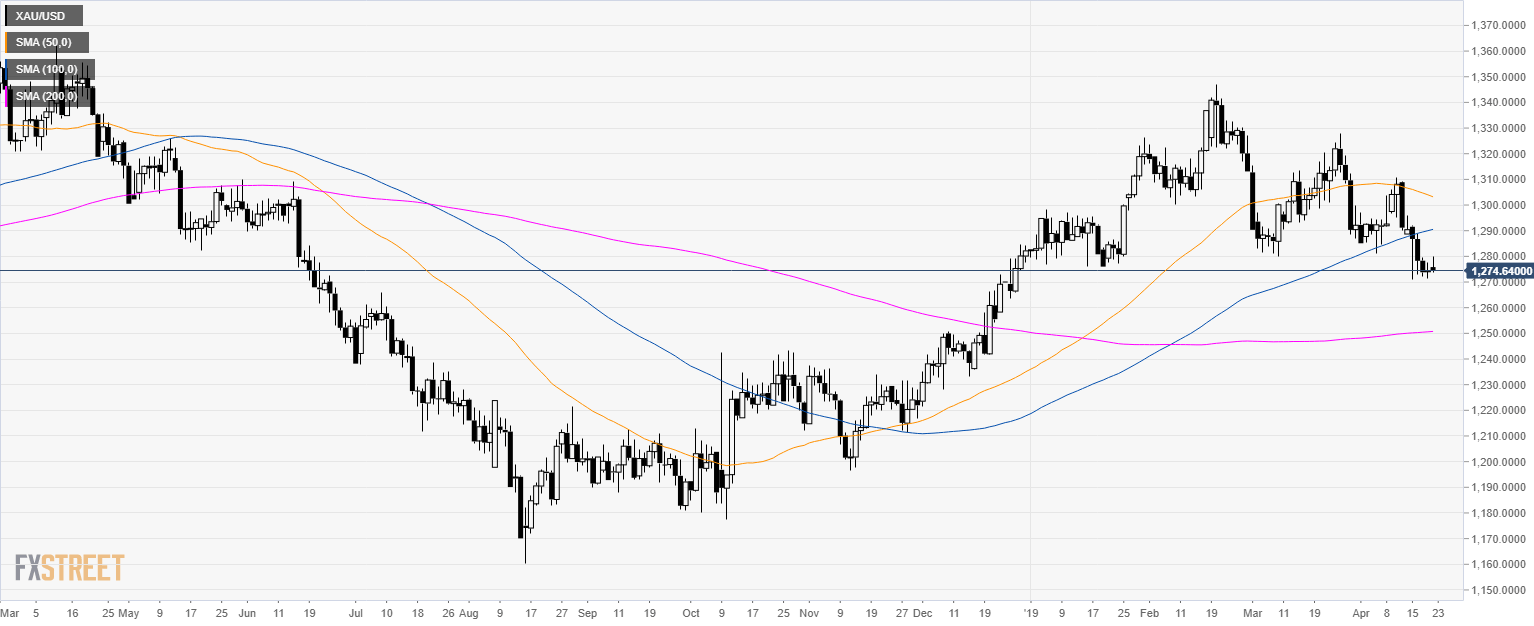
Gold daily chart
- Gold broke below 1,280.00 and the 100 and 200 simple moving averages (SMAs) suggesting that a correction down is underway.
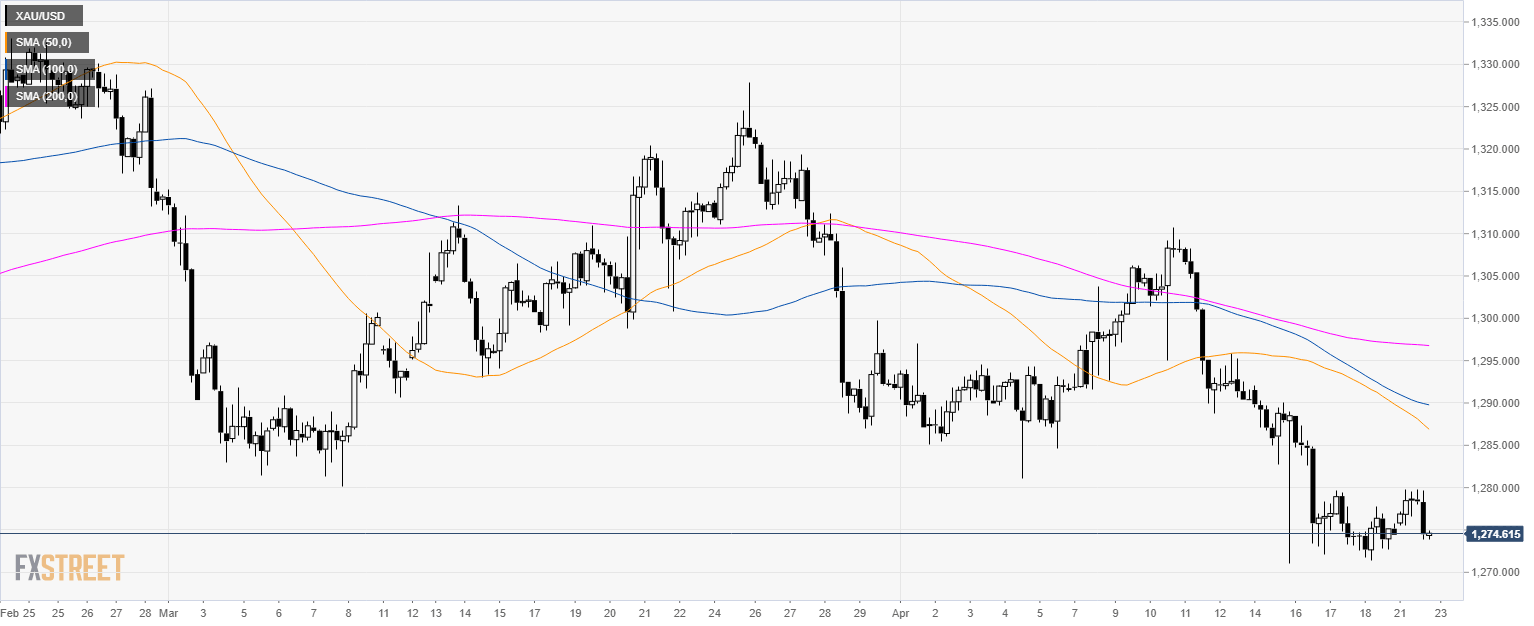
Gold 4-hour chart
- The Yellow Metal remains capped below 1,280.00 as it is trading below its main SMAs. All-in-all suggesting a bearish bias also in the medium-term.
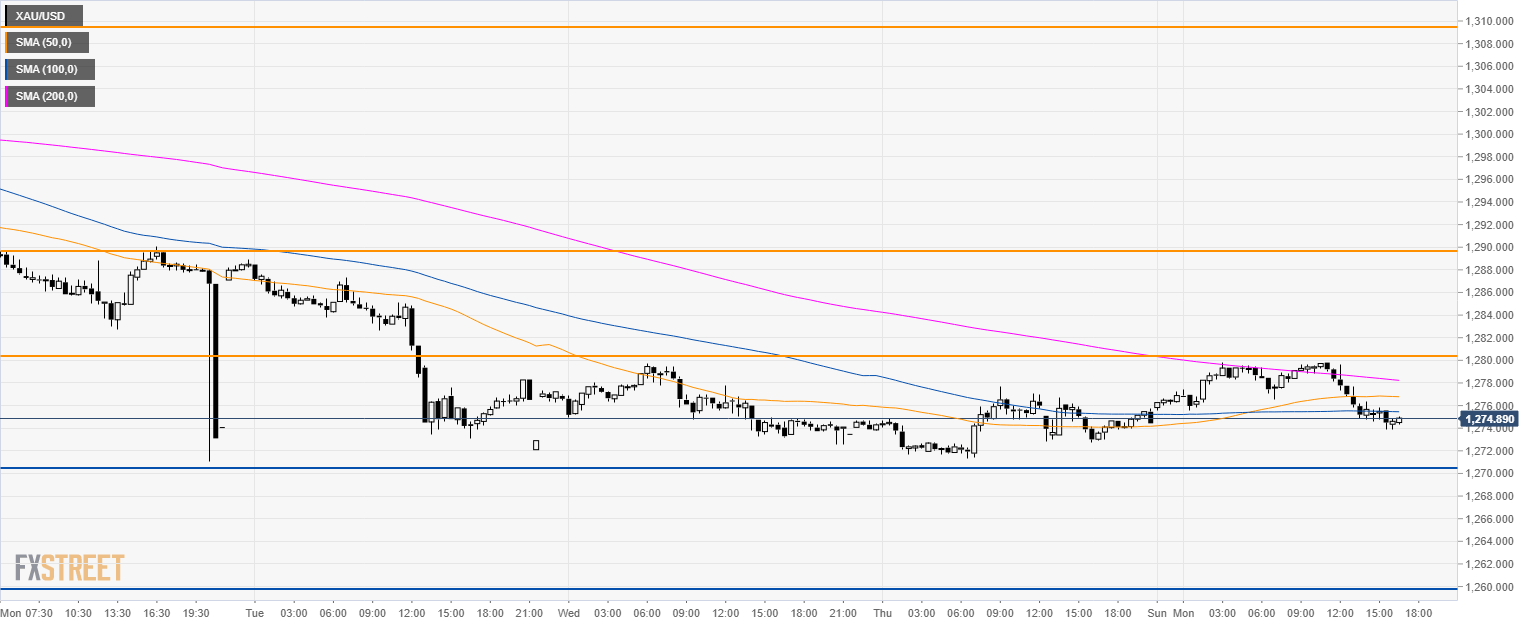
Gold 30-minute chart
- Gold is trading below its main SMAs suggesting a bearish momentum in the short-term.
- A break below 1,270.00 can lead to 1,260.00 level and 1,247.00 support.
- Resistance is at 1,280.00 and 1,290.00 figure.
Additional key levels
