- Gold is consolidating the recent rally of the last months while trading below the 1,500 mark.
- Gold is under pressure below the 1,490 resistance and the 50-day SMA.
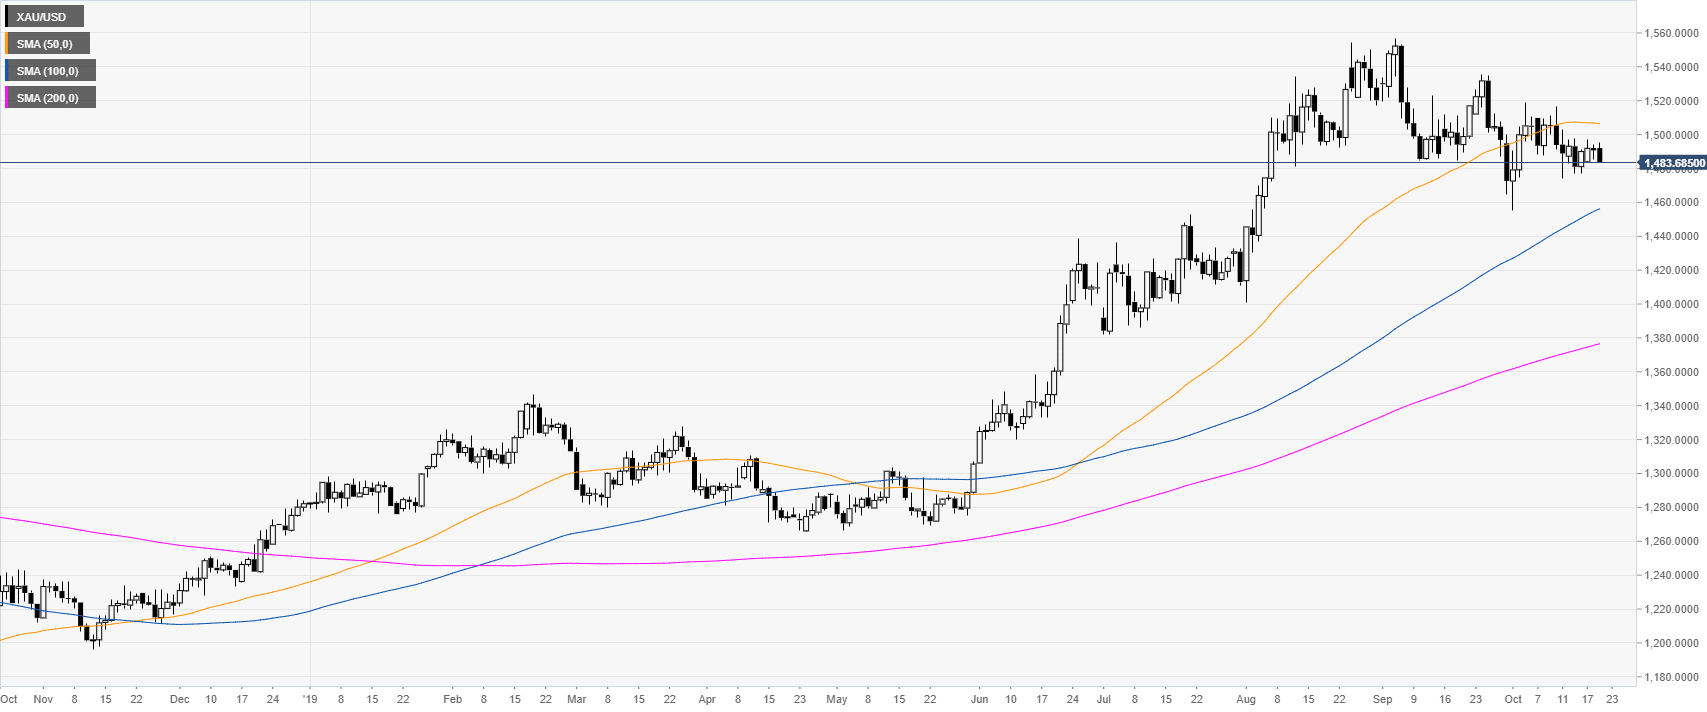
Gold daily chart
The yellow metal is trading in a bull trend above the 100 and 200-day simple moving averages (DSMAs). However, in the last weeks of trading, the metal has been consolidating near $1,500 per ounce and below the 50 SMA.
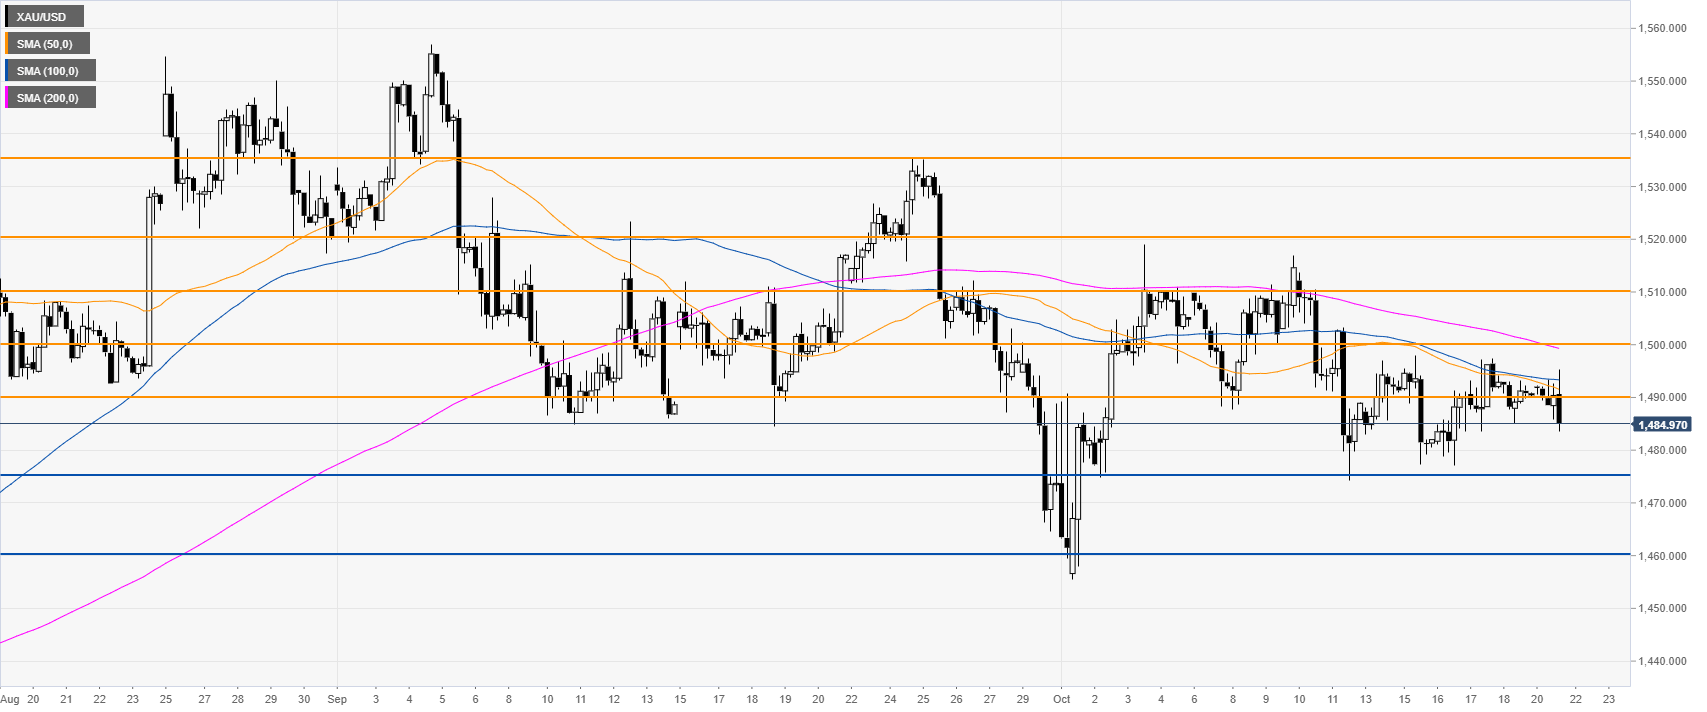
Gold four-hour chart
The yellow metal is trading below the main simple moving averages (SMAs) and below the 1,500 mark; all-in-all suggesting a bearish bias in the medium term. The break below $1,490 a troy once can expose the 1,475/1,460 support zone.
On the flip side, a daily close above 1,500 figure could lead to a correction towards the 1,510/1,520 resistance zone.
Additional key levels
