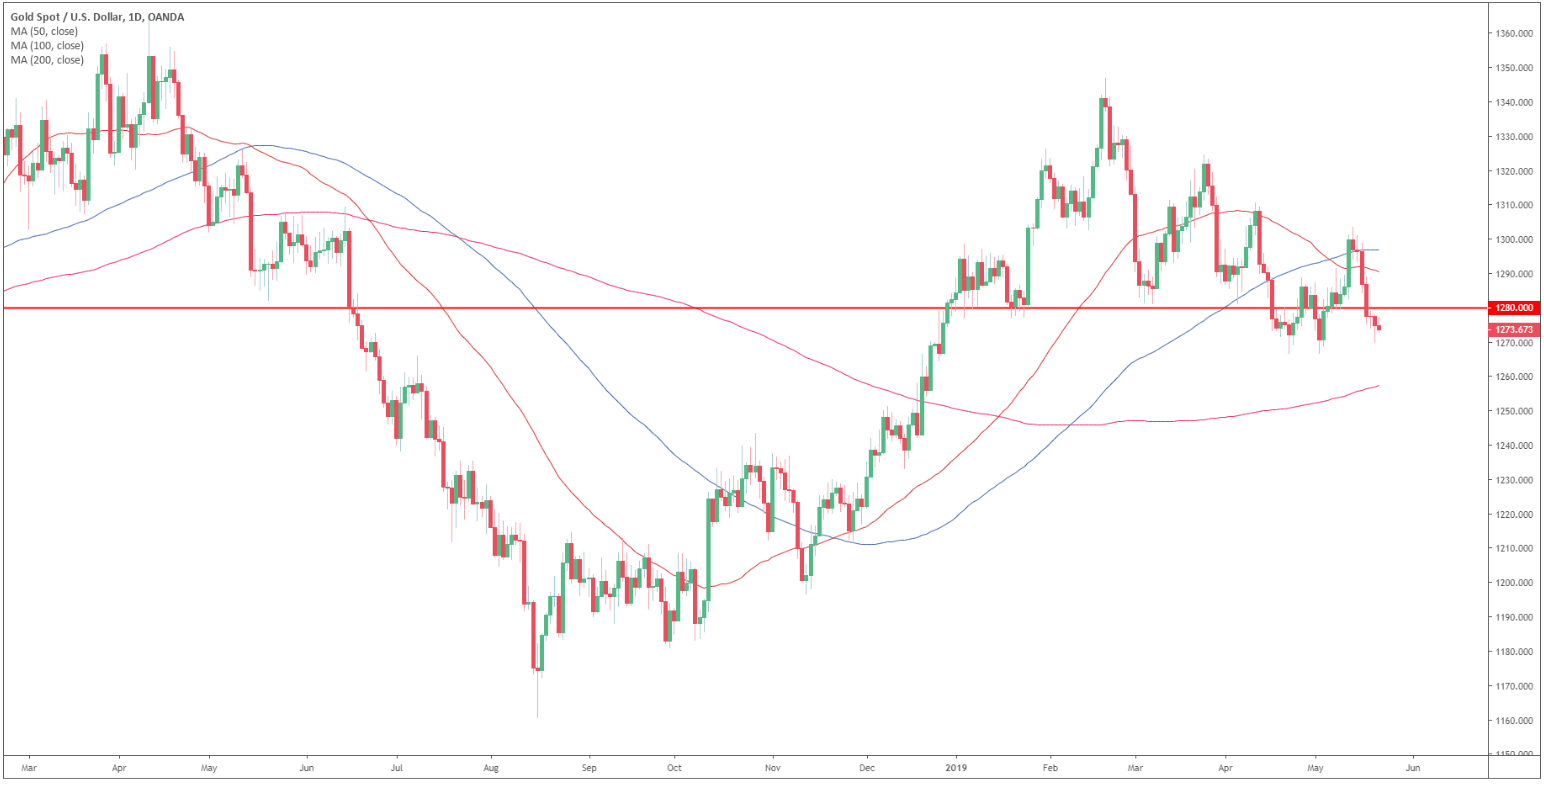
Gold daily chart
Gold is trading below 1,280.00 resistance and the 50 and 100-period simple moving averages (SMAs).
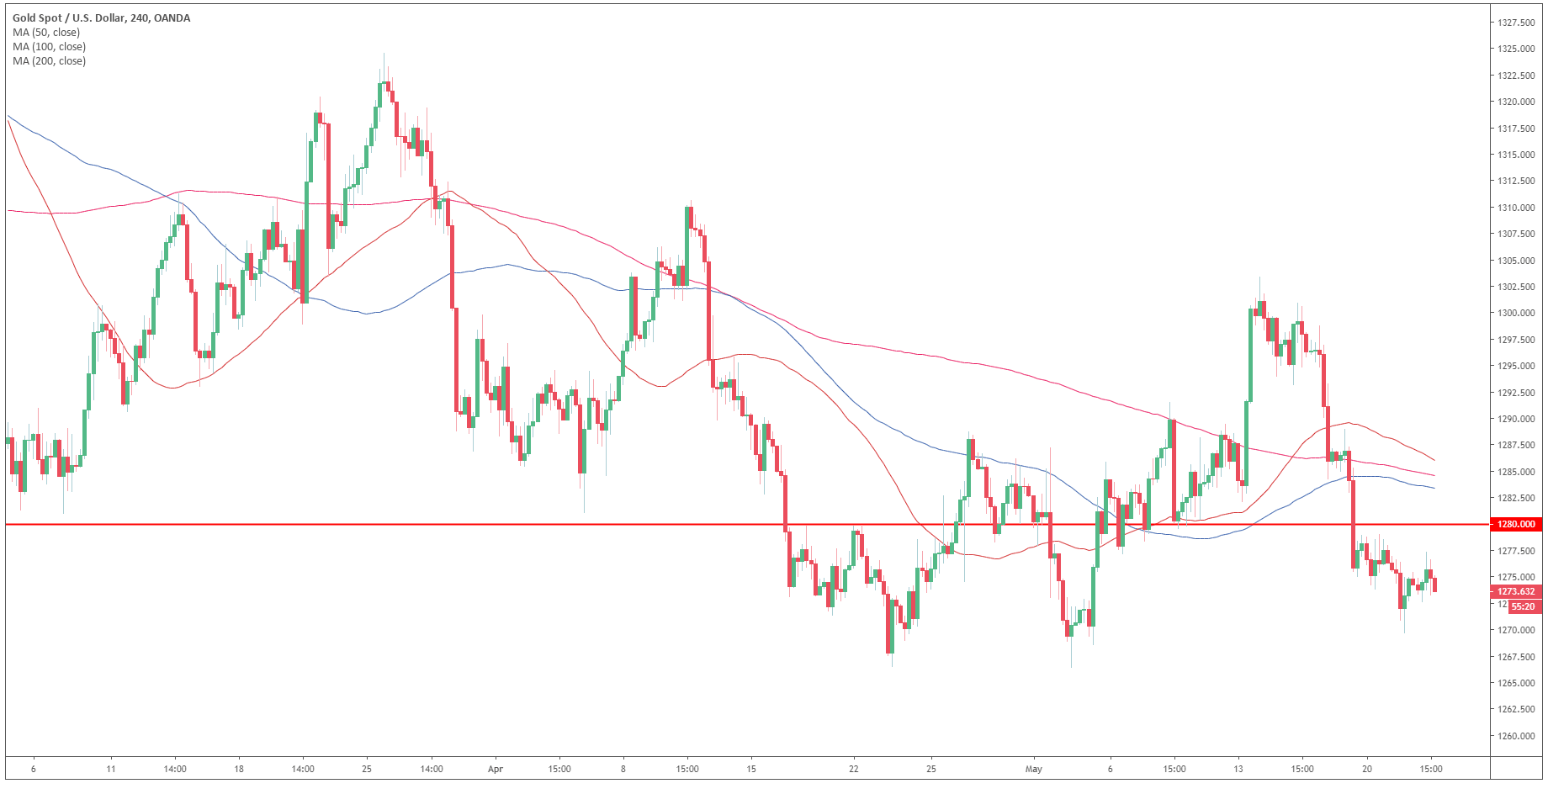
Gold 4-hour chart
Gold is trading below its main SMAs suggesting bearish momentum in the medium term.
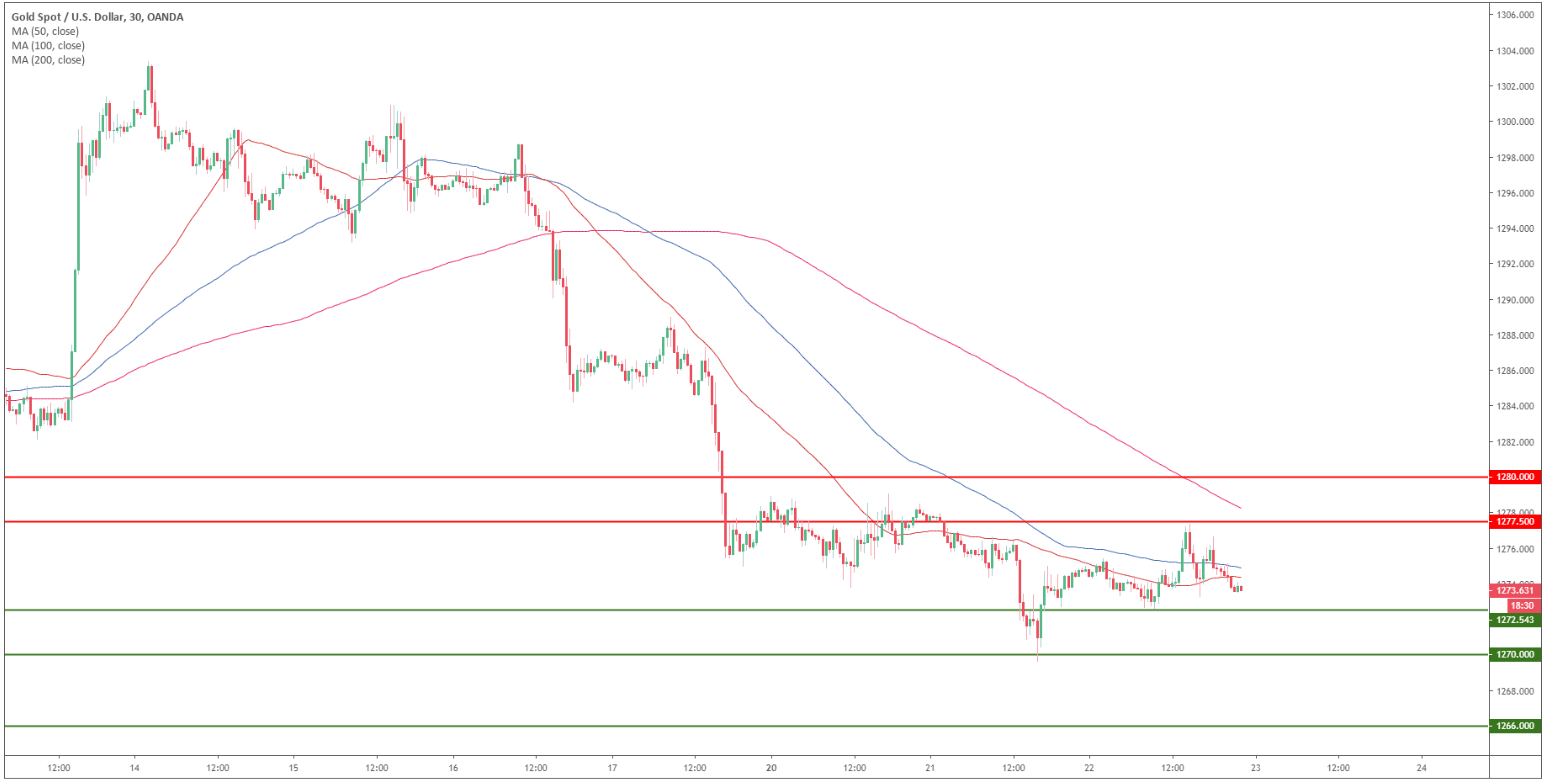
Gold 30-minute chart
The market is trading below 1,277.00 resistance and its main SMAs suggesting bearish momentum in the near term. If bears break 1,272.50 support the market can continue to drop towards 1,270.00 and potentially to 1,266.00 if the bears gather enough steam. Resistances are at 1,277.50 and 1,280.00 levels.
Additional key levels
