In the following daily AUDUSD chart, we see the Ichimoku indicator accompanied by Candlestick Patterns. Prices have been on a strong downtrend, far and wide below the Kumo cloud resistance since April 2013.
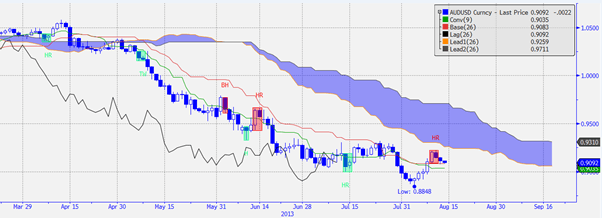
AUDUSD Daily Chart from Bloomberg
We draw your attention to the 3 Candlestick patterns shaded in red, named BH and HR. These represent the follow patterns:
Belt Hold Line (BH): Bearish belt hold opens on high and closes at or near low of candle after a preceding uptrend.
Harami (HR): Second real body is relatively small and contained within the prior session’s real body.
Note how the bearish candlestick patterns reinforce and confirm the bearish Ichimoku trend, pushing prices lower with each appearance. This is an example of price action forex signals confirming a trend indicator.
We see the black lagging Chikou Span line flirting with prices. Bears should be careful if Chikou Span stays above prices, as that could signal the start of a bullish reversal. Nonetheless, the thick Kumo cloud still poses a hurdle for the bulls.
Written By: Streetpips.com
Streetpips.com scans books and websites for trading strategy ideas. We then select those which are programmable, code them, and share these with our members.
